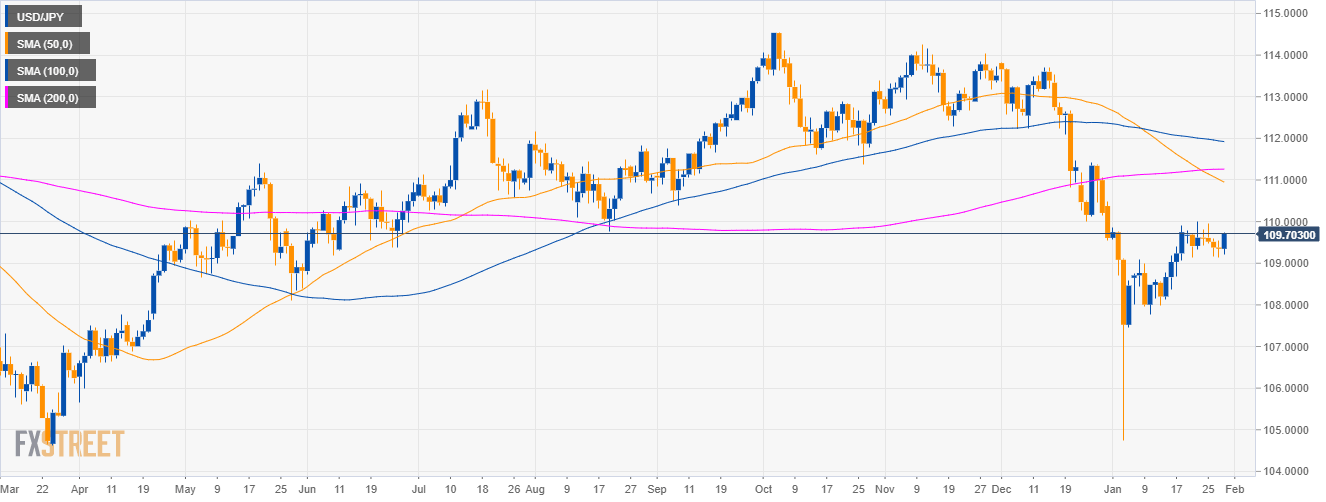
USD/JPY daily chart
- USD/JPY is trading in a deep pullback below the 50, 100 and 200-day simple moving averages (SMAs) on the daily chart.
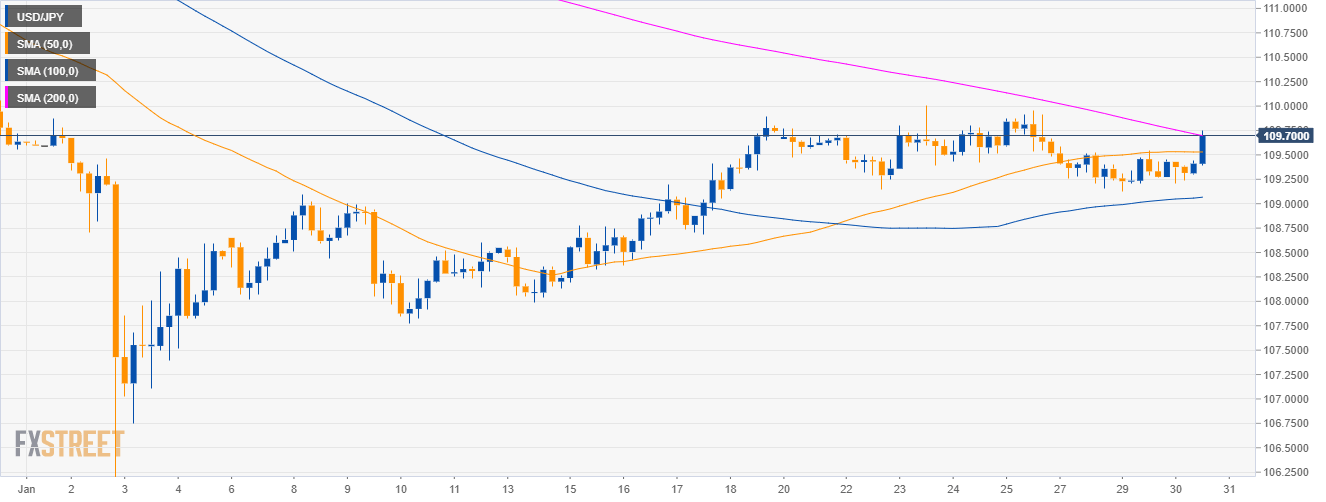
USD/JPY 4-hour chart
- USD/JPY is testing the 200 SMA.
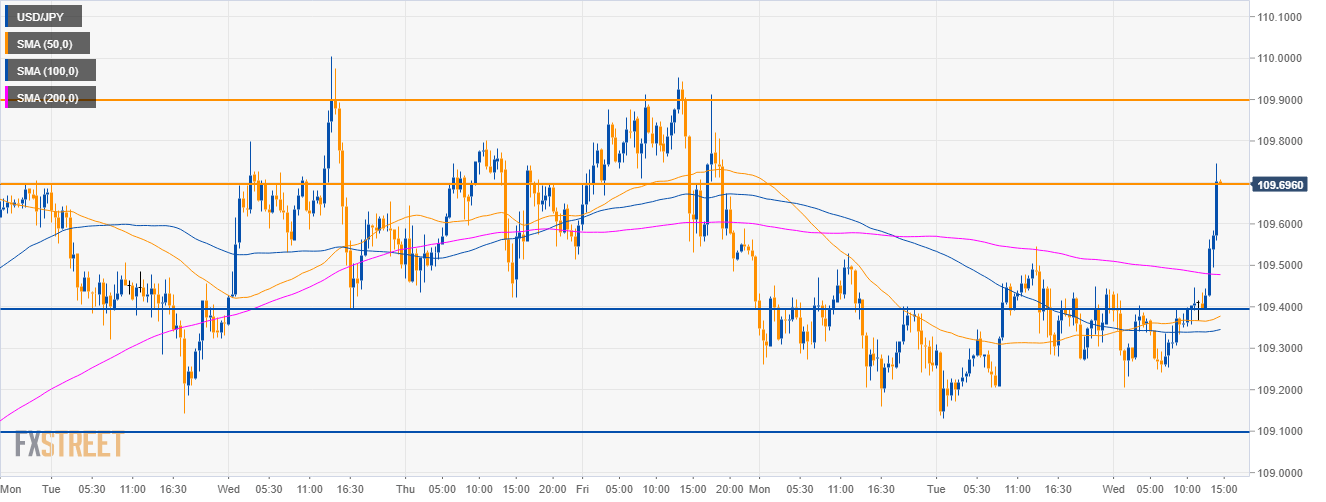
USD/JPY 30-minute chart
- USD/JPY bulls reclaimed the main SMAs and are challenging the 109.70 resistance. A break of the level could open the doors to the 109.90 level.
Additional key levels
USD/JPY
Overview:
Today Last Price: 109.7
Today Daily change: 35 pips
Today Daily change %: 0.32%
Today Daily Open: 109.35
Trends:
Daily SMA20: 108.95
Daily SMA50: 111.01
Daily SMA100: 111.94
Daily SMA200: 111.26
Levels:
Previous Daily High: 109.55
Previous Daily Low: 109.13
Previous Weekly High: 110
Previous Weekly Low: 109.14
Previous Monthly High: 113.83
Previous Monthly Low: 109.55
Daily Fibonacci 38.2%: 109.29
Daily Fibonacci 61.8%: 109.39
Daily Pivot Point S1: 109.14
Daily Pivot Point S2: 108.92
Daily Pivot Point S3: 108.72
Daily Pivot Point R1: 109.55
Daily Pivot Point R2: 109.76
Daily Pivot Point R3: 109.97
