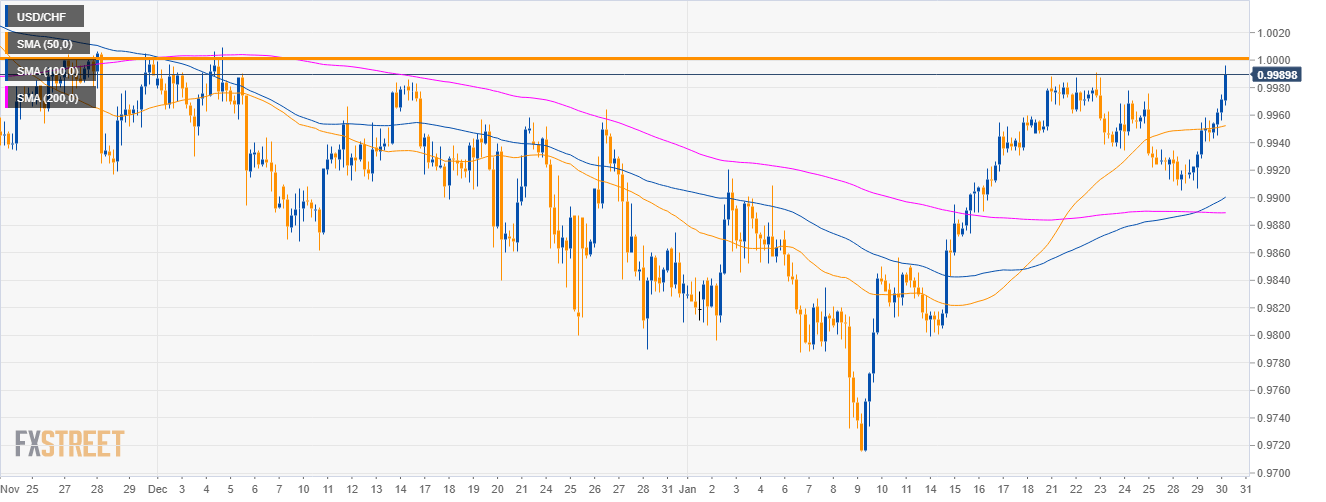
USD/CHF daily chart
- USD/CHF is trading in a sideways trend as the currency pair is above the 50, 100 and 200-day simple moving averages (SMAs).
- The Fed’s Monetary Policy Statement at 19.00 GMT and the FOMC press conference this Wednesday can provide volatility in the forex market.
-636844567885251792.png)
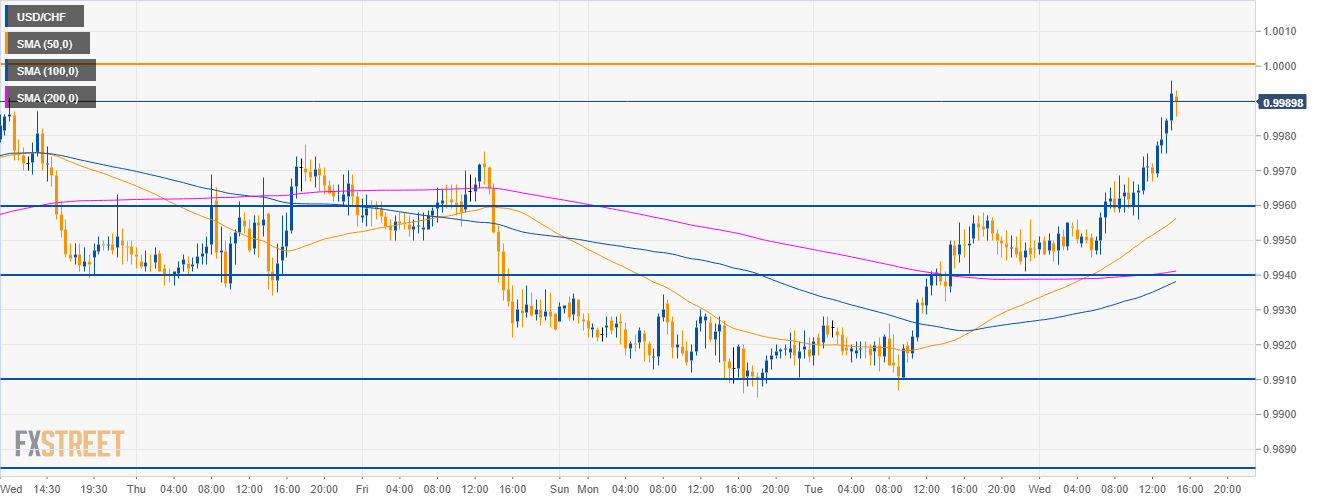
USD/CHF 4-hour chart
- USD/CHF rose sharply to the parity level. What will happen now?
USD/CHF 30-minute chart
- The current short-term bias is bullish and Greenback bulls will have to break the key resistance level at 1.0000 in order to confirm extra-gains.
- To the downside, bears will be looking at the 0.9960 and 0.9940 level.
Additional key levels
USD/CAD
Overview:
Today Last Price: 1.3222
Today Daily change: -58 pips
Today Daily change %: -0.44%
Today Daily Open: 1.328
Trends:
Daily SMA20: 1.3311
Daily SMA50: 1.338
Daily SMA100: 1.3215
Daily SMA200: 1.3125
Levels:
Previous Daily High: 1.3287
Previous Daily Low: 1.324
Previous Weekly High: 1.3378
Previous Weekly Low: 1.3224
Previous Monthly High: 1.4134
Previous Monthly Low: 1.316
Daily Fibonacci 38.2%: 1.3269
Daily Fibonacci 61.8%: 1.3258
Daily Pivot Point S1: 1.3251
Daily Pivot Point S2: 1.3222
Daily Pivot Point S3: 1.3205
Daily Pivot Point R1: 1.3298
Daily Pivot Point R2: 1.3315
Daily Pivot Point R3: 1.3344
