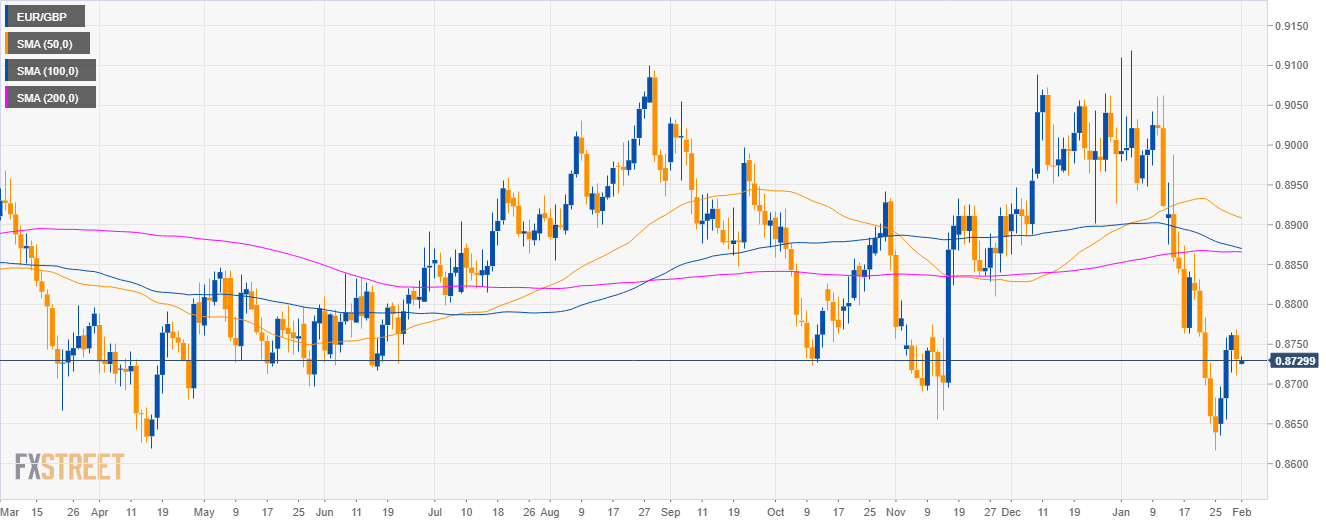
EUR/GBP daily chart
- EUR/GBP is trading in a sideways trend below the 50, 100 and 200-day simple moving averages (SMAs).
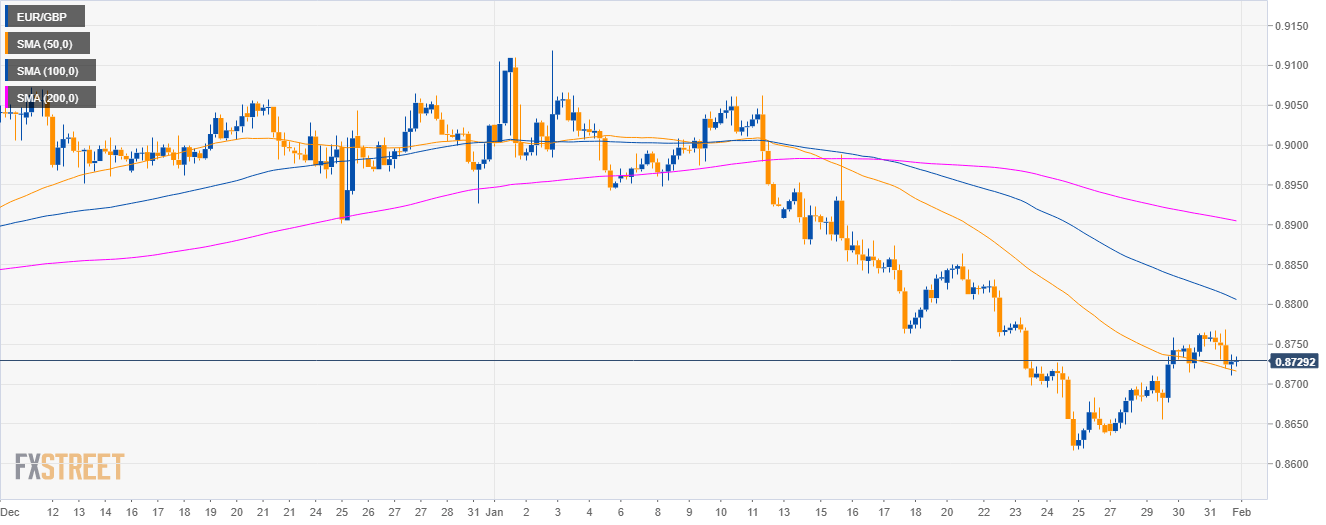
EUR/GBP 4-hour chart
- EUR/GBP is trading below the 100 and 200 SMA on the 4-hour chart.
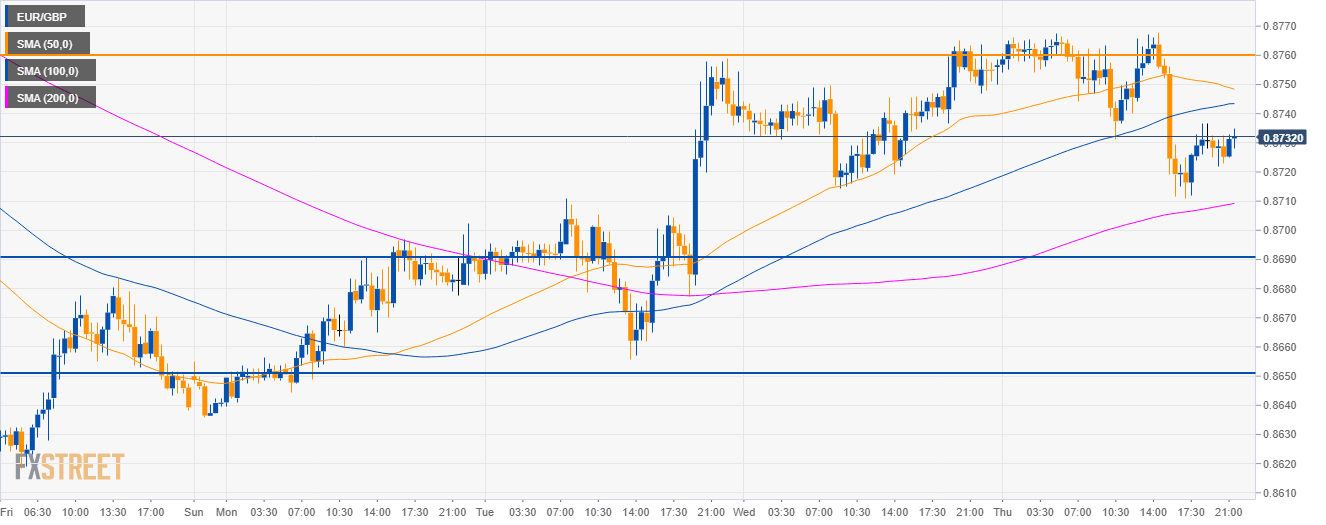
EUR/GBP 30-minute chart
- EUR/GBP found resistance at the 0.8760 resistance and bears stepped in and drove the market below the 50 and 100 SMA.
- At this stage, it seems that bulls are running out of steam and a drop to 0.8690 and 0.8650 can potentially be on the cards in the coming sessions.
Additional key levels
EUR/GBP
Overview:
Today Last Price: 0.873
Today Daily change: -31 pips
Today Daily change %: -0.35%
Today Daily Open: 0.8761
Trends:
Daily SMA20: 0.8846
Daily SMA50: 0.8913
Daily SMA100: 0.8874
Daily SMA200: 0.8866
Levels:
Previous Daily High: 0.8765
Previous Daily Low: 0.8714
Previous Weekly High: 0.8864
Previous Weekly Low: 0.8617
Previous Monthly High: 0.9089
Previous Monthly Low: 0.8863
Daily Fibonacci 38.2%: 0.8746
Daily Fibonacci 61.8%: 0.8734
Daily Pivot Point S1: 0.8729
Daily Pivot Point S2: 0.8696
Daily Pivot Point S3: 0.8678
Daily Pivot Point R1: 0.878
Daily Pivot Point R2: 0.8798
Daily Pivot Point R3: 0.883
