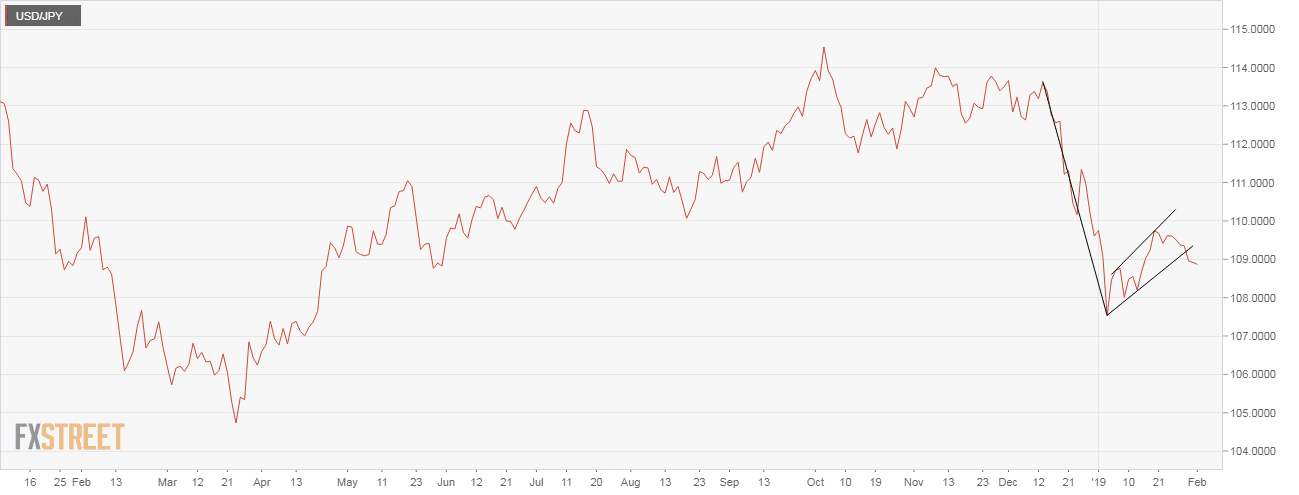
- The USD/JPY pair closed yesterday at 108.85, confirming a bear flag breakdown on the daily line chart.
- That pattern usually ends up accelerating the preceding bearish move. Put simply, the pattern has opened up downside toward 103.00 – target as per the measured move method, that is, pole length subtracted from breakdown price.
- The bearish setup would be invalidated above the psychological hurdle of 110.00.
Daily chart
Trend: bearish
USD/JPY
Overview:
Today Last Price: 108.87
Today Daily change: -5 pips
Today Daily change %: -0.05%
Today Daily Open: 108.92
Trends:
Daily SMA20: 109.01
Daily SMA50: 110.85
Daily SMA100: 111.89
Daily SMA200: 111.26
Levels:
Previous Daily High: 109.08
Previous Daily Low: 108.5
Previous Weekly High: 110
Previous Weekly Low: 109.14
Previous Monthly High: 110
Previous Monthly Low: 104.75
Daily Fibonacci 38.2%: 108.72
Daily Fibonacci 61.8%: 108.86
Daily Pivot Point S1: 108.58
Daily Pivot Point S2: 108.24
Daily Pivot Point S3: 107.99
Daily Pivot Point R1: 109.17
Daily Pivot Point R2: 109.42
Daily Pivot Point R3: 109.76
