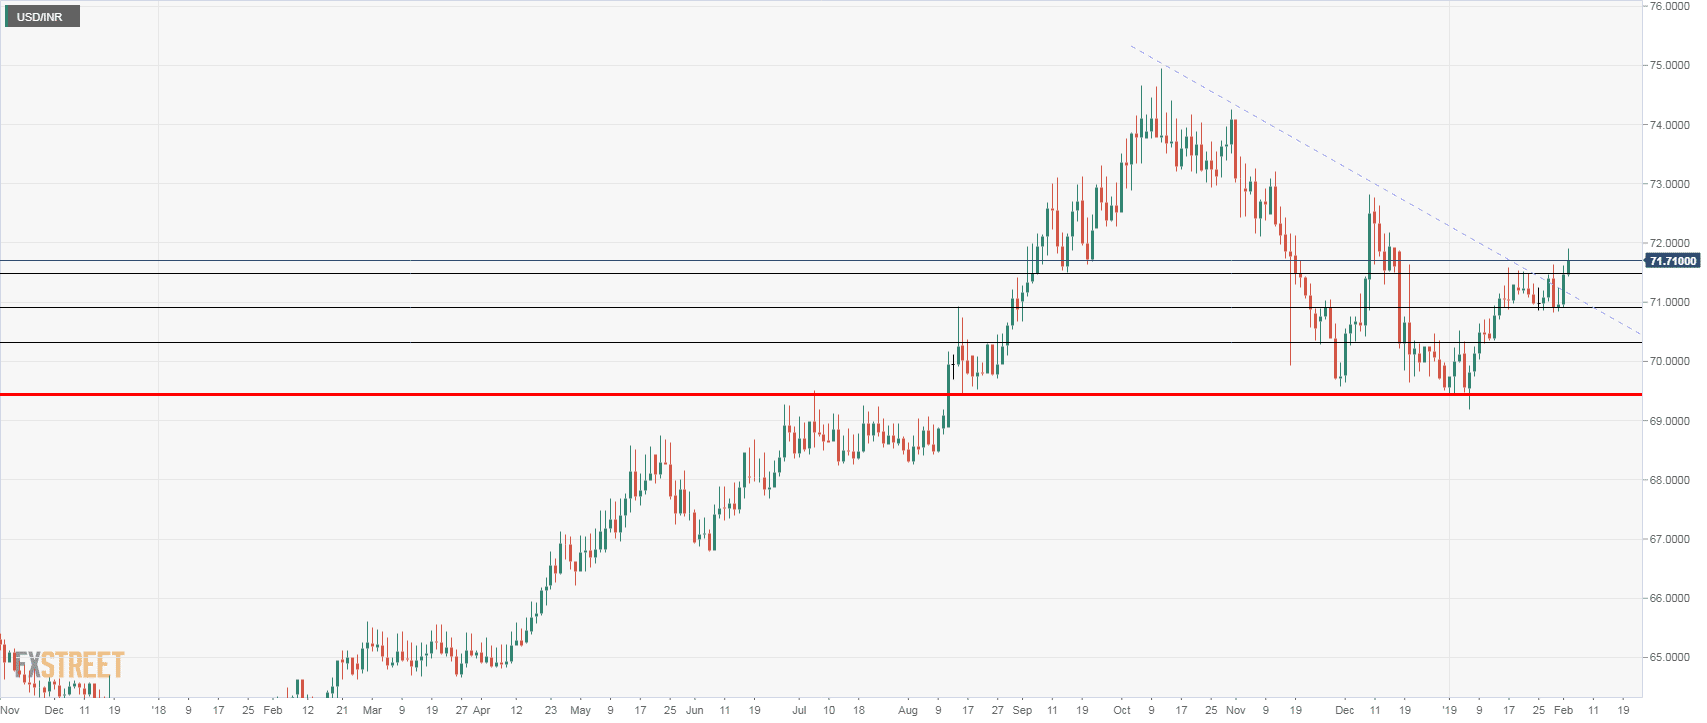
- The US Dollar broke the key 71.50 area, strengthening the bullish bias. It peaked at 71.91, before pulling back modestly to 71.72. It is about to post the highest close since December 28.
- The positive tone will remain intact as long as USD/INR holds above 71.50. A test of the 72.00 area seems likely, and a break higher would target 72.25.
- A firm slide back below 71.50 would put the recent range (71.50 – 70.85) back in play.
USD/INR Daily chart
USD/INR
Overview:
Today Last Price: 71.7
Today Daily change: 0.2250 pips
Today Daily change %: 0.31%
Today Daily Open: 71.475
Trends:
Daily SMA20: 70.8916
Daily SMA50: 70.7085
Daily SMA100: 71.7996
Daily SMA200: 70.2777
Levels:
Previous Daily High: 71.615
Previous Daily Low: 70.915
Previous Weekly High: 71.64
Previous Weekly Low: 70.82
Previous Monthly High: 71.64
Previous Monthly Low: 69.185
Daily Fibonacci 38.2%: 71.3476
Daily Fibonacci 61.8%: 71.1824
Daily Pivot Point S1: 71.055
Daily Pivot Point S2: 70.635
Daily Pivot Point S3: 70.355
Daily Pivot Point R1: 71.755
Daily Pivot Point R2: 72.035
Daily Pivot Point R3: 72.455
