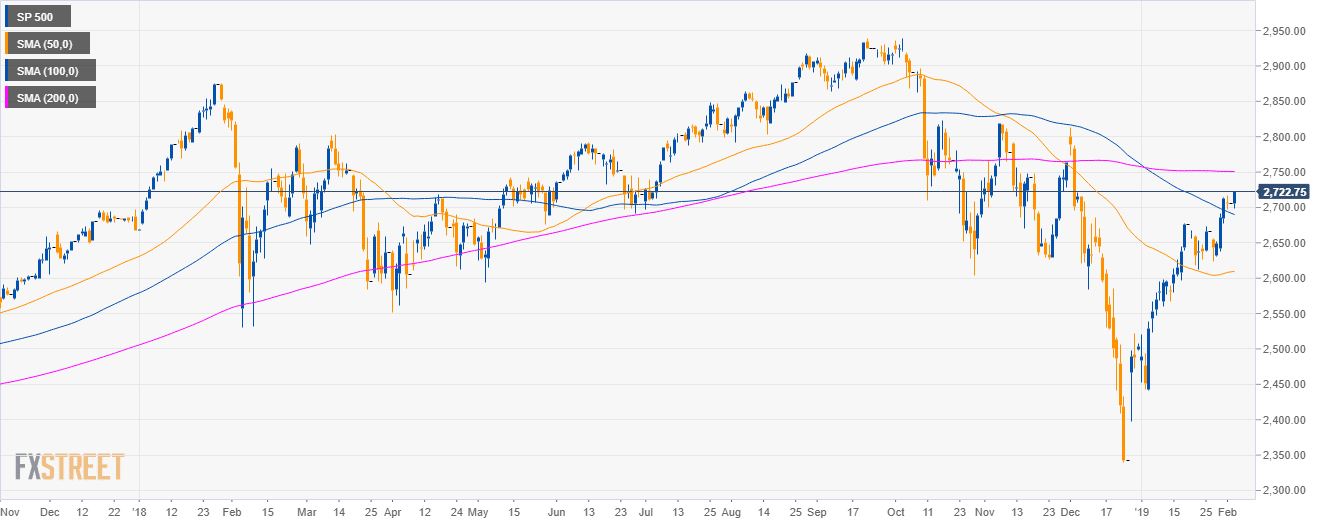
S&P500 daily chart
- The S&P500 Index is having a strong bullish recovery after the deep pullback below the 200-day simple moving average (SMA).
- The market has retaken the 50 and 100 SMA as the market is at 2-month’s high.
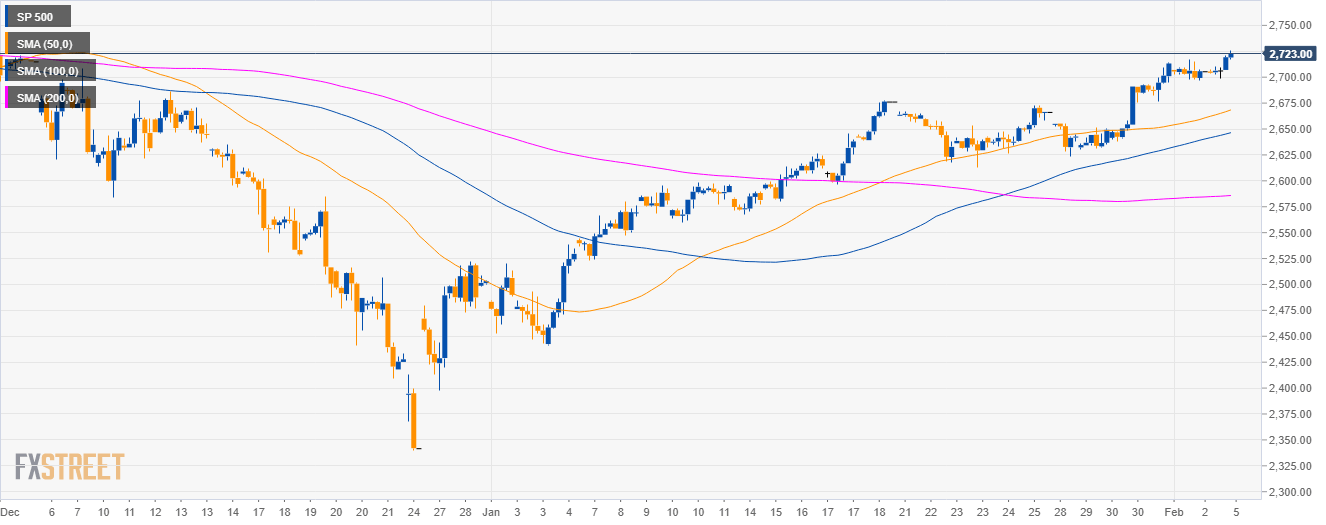
S&P500 4-hour chart
- The S&P500 is trading above the 50, 100 and 200 SMAs suggesting a bullish momentum in the medium-term.
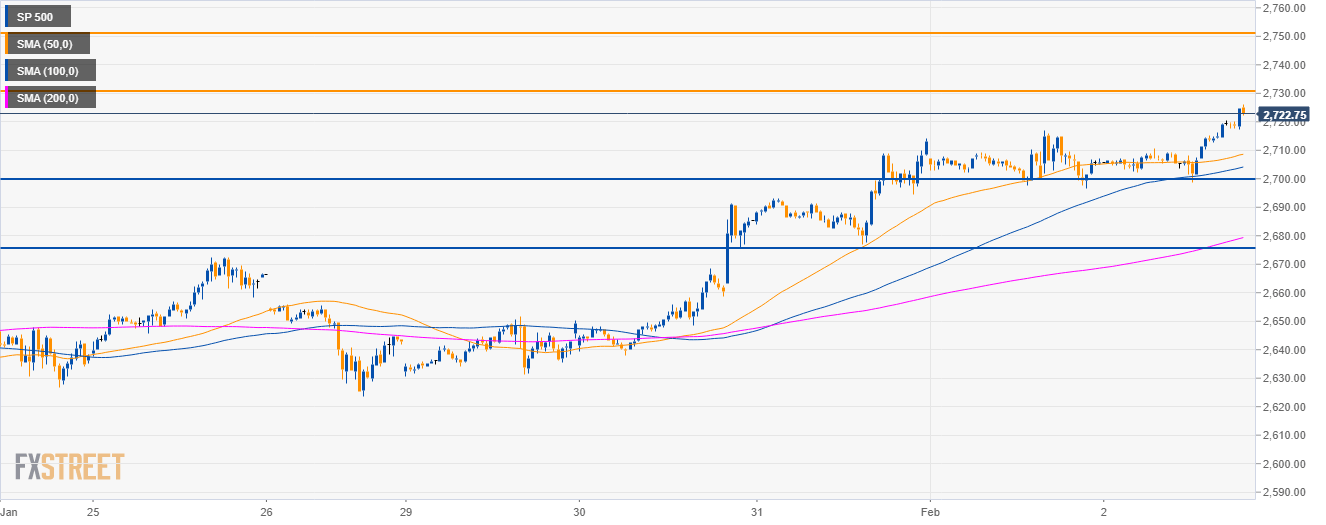
S&P500 30-minute chart
- The S&P500 is trading above its main SMAs suggesting bullish momentum.
- Resistance can be seen near 2,730.00 and 2,750.00 levels.
- To the downside, support can be expected at the 2,700.00 and 2,655.00 levels.
Additional key levels
SP 500
Overview:
Today Last Price: 2724.75
Today Daily change: 19 points
Today Daily change %: 0.70%
Today Daily Open: 2705.75
Trends:
Daily SMA20: 2649.46
Daily SMA50: 2609.03
Daily SMA100: 2691.92
Daily SMA200: 2750.81
Levels:
Previous Daily High: 2705.75
Previous Daily Low: 2705.75
Previous Weekly High: 2717
Previous Weekly Low: 2623.75
Previous Monthly High: 2714
Previous Monthly Low: 2441
Daily Fibonacci 38.2%: 2705.75
Daily Fibonacci 61.8%: 2705.75
Daily Pivot Point S1: 2705.75
Daily Pivot Point S2: 2705.75
Daily Pivot Point S3: 2705.75
Daily Pivot Point R1: 2705.75
Daily Pivot Point R2: 2705.75
Daily Pivot Point R3: 2705.75
