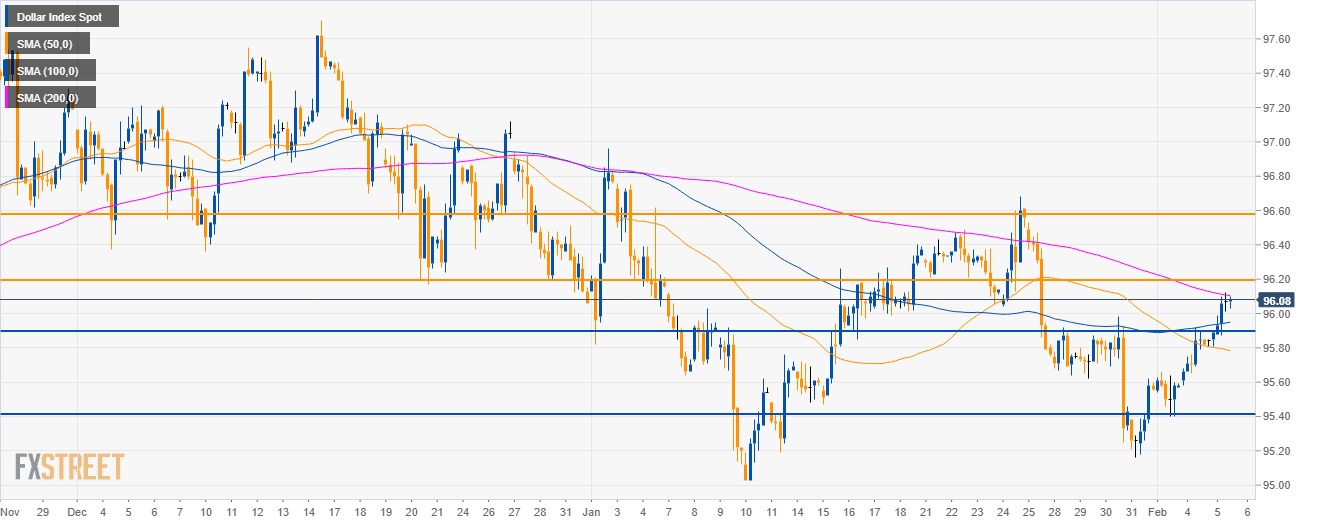
DXY 4-hour chart
- The US Dollar Index (DXY) is challenging the 200 SMA.
- A break above it and the 96.20 resistance can open the gates to the 96.60 level.
- On the way down, investors can expect support at 95.90 and 95.40 level.
Additional key levels
Dollar Index Spot
Overview:
Today Last Price: 96.08
Today Daily change %: 0.27%
Today Daily Open: 95.82
Trends:
Daily SMA20: 95.88
Daily SMA50: 96.45
Daily SMA100: 96.16
Daily SMA200: 95.32
Levels:
Previous Daily High: 95.92
Previous Daily Low: 95.58
Previous Weekly High: 95.98
Previous Weekly Low: 95.16
Previous Monthly High: 96.96
Previous Monthly Low: 95.03
Daily Fibonacci 38.2%: 95.79
Daily Fibonacci 61.8%: 95.71
Daily Pivot Point S1: 95.63
Daily Pivot Point S2: 95.43
Daily Pivot Point S3: 95.29
Daily Pivot Point R1: 95.97
Daily Pivot Point R2: 96.11
Daily Pivot Point R3: 96.31
