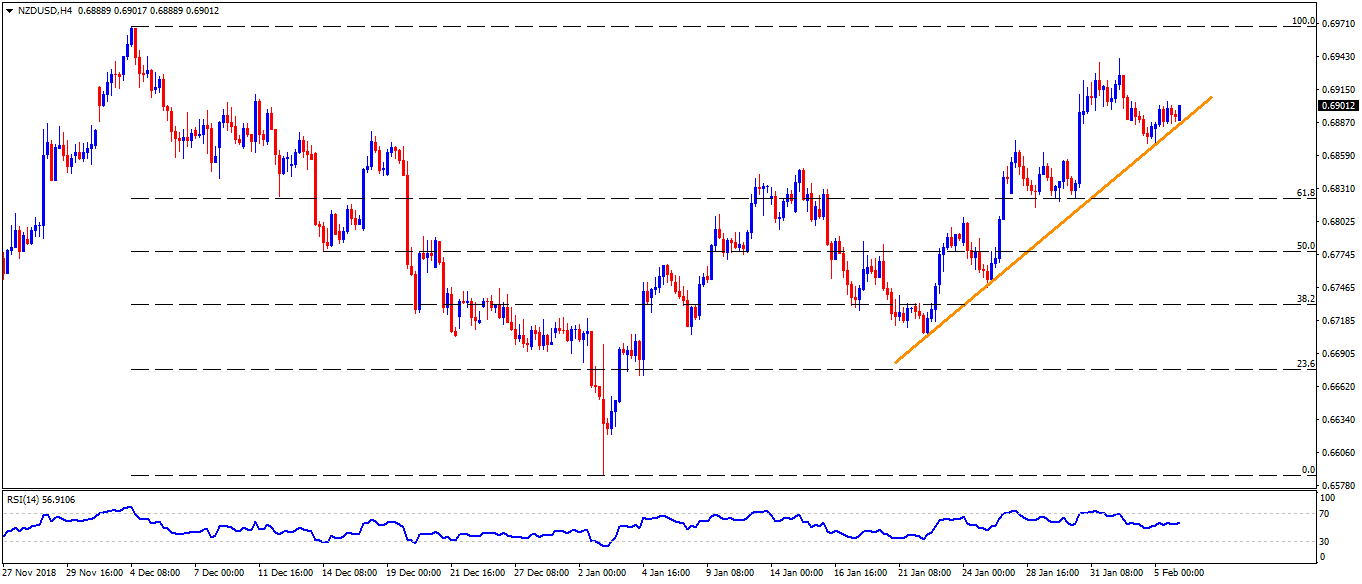
- The NZD/USD pair remains positive around 0.6900 at the start of Wednesday’s Asian trading. Supporting the pair’s strength is a fortnight long upward sloping trendline at 0.6880 now.
- As a result, the pair’s gradual advances to the 0.6910 and the 0.6940 can be expected soon before highlighting the 0.6970 for the bulls.
- Should the quote continue rising past-0.6970, the 0.7000 and the 0.7030 are likely following resistances to appear on the chart.
- On the downside break of 0.6880, the pair may revisit the 0.6840 and the 0.6800 support levels.
- In case prices slid under 0.6800, the 0.6750-45 and the 0.6690 might entertain the sellers.
NZD/USD 4-Hour chart
NZD/USD
Overview:
Today Last Price: 0.6902
Today Daily change: 0.0007 pips
Today Daily change %: 0.10%
Today Daily Open: 0.6895
Trends:
Daily SMA20: 0.6817
Daily SMA50: 0.6804
Daily SMA100: 0.672
Daily SMA200: 0.6761
Levels:
Previous Daily High: 0.6907
Previous Daily Low: 0.6871
Previous Weekly High: 0.6943
Previous Weekly Low: 0.6816
Previous Monthly High: 0.694
Previous Monthly Low: 0.6516
Daily Fibonacci 38.2%: 0.6893
Daily Fibonacci 61.8%: 0.6885
Daily Pivot Point S1: 0.6875
Daily Pivot Point S2: 0.6855
Daily Pivot Point S3: 0.6839
Daily Pivot Point R1: 0.6911
Daily Pivot Point R2: 0.6927
Daily Pivot Point R3: 0.6947
