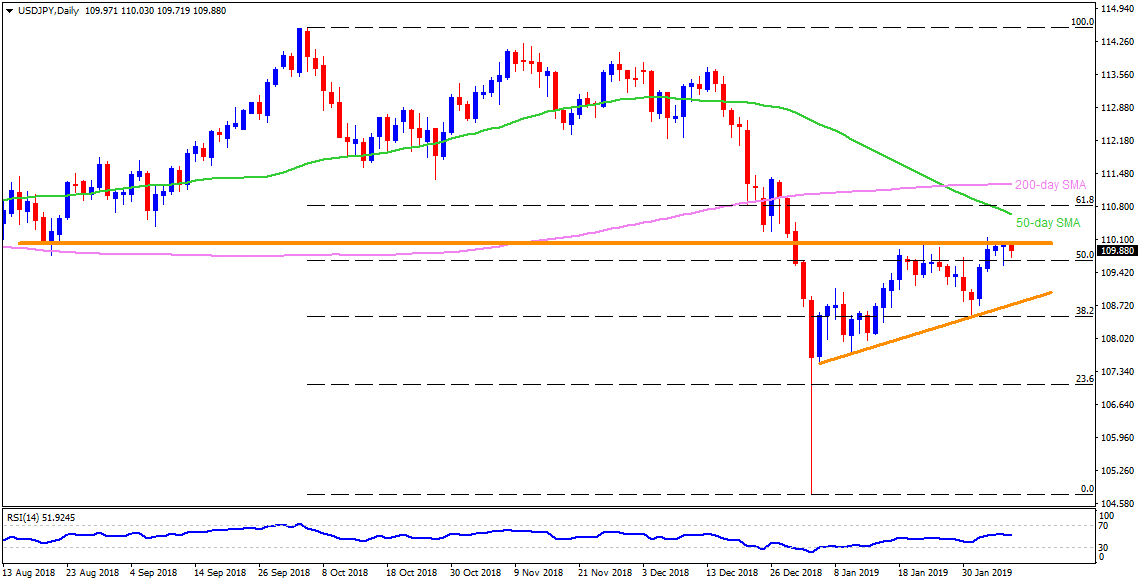
USD/JPY daily chart
- A horizontal-line connecting August 2018 closing lows to the highs marked during 2019 so far restricts USD/JPY upside around 110.00 on early Thursday.
- As a result, chances of the pair’s pullback to the 109.10 and then to the 108.70 support-line can’t be denied.
- On the flip side, a daily closing beyond 110.00 can trigger an upside towards 50-day simple moving average (SMA) level of 110.65 prior to highlighting 111.25, including 200-day SMA, as resistance.
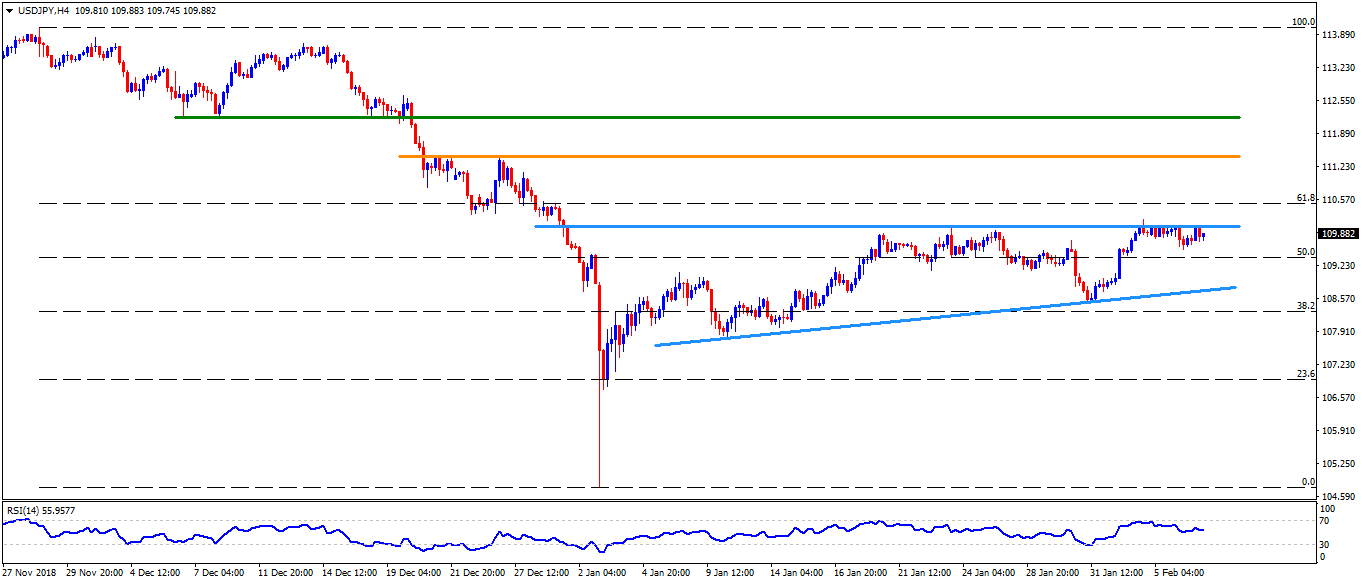
USD/JPY 4-hour chart
- On the shorter time frame, 109.50 can offer immediate support ahead of shifting focus to the 109.10 and then to the 108.70.
- If there prevail additional downside pressure after 108.70, then 108.50 and 107.70 could regain market attention.
- Meanwhile, 61.8% Fibonacci Retracement of its recent declines, around 110.50, acts as adjacent resistance for the pair once it clears the 110.00 barrier.
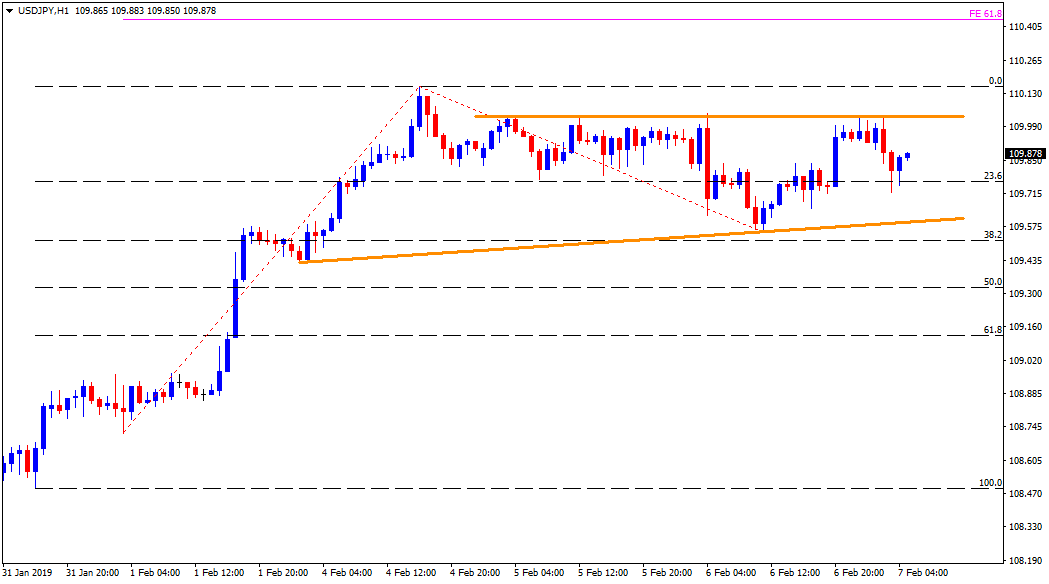
USD/JPY Hourly chart
- The 109.60 and the 110.00 restricts the pair’s near-term moves with 109.50 and the 110.15 being follow-on levels to observe on either side breaks.
- The 61.8% Fibonacci expansion on latest pullback, at 110.45 can please buyers after 110.15 while 109.50 and 109.10 seem sellers’ bets past-109.60.