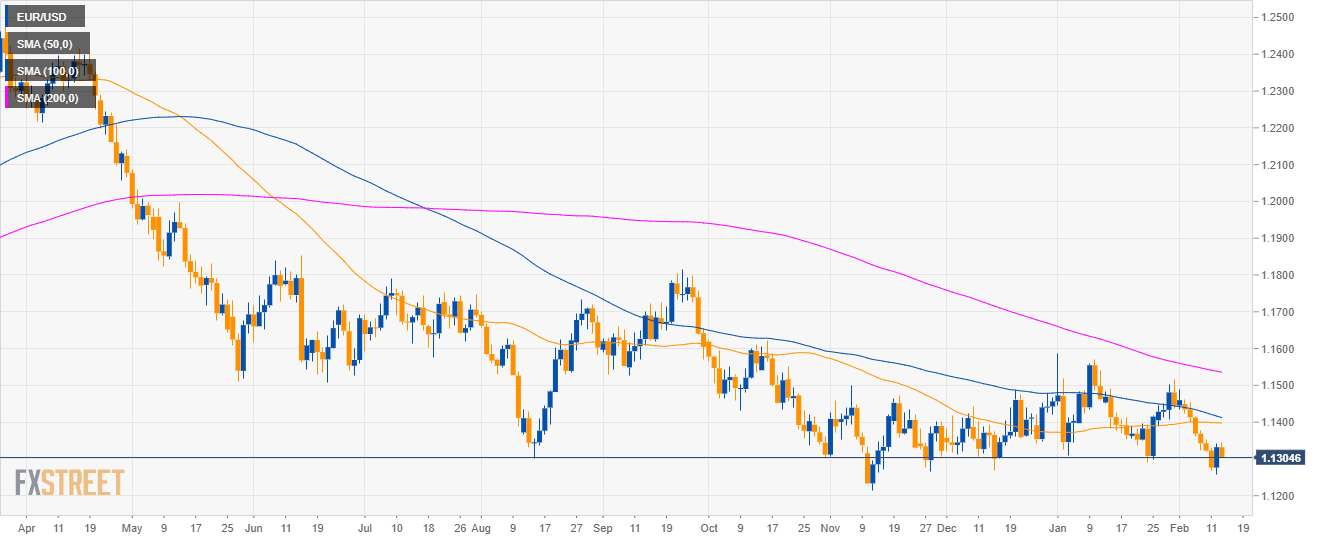
EUR/USD daily chart
- EUR/USD is trading in a bear trend below the 200-day simple moving average (SMA).
- The US Consumer Price Index (CPI) for the month of January will be released at 13.30 GMT
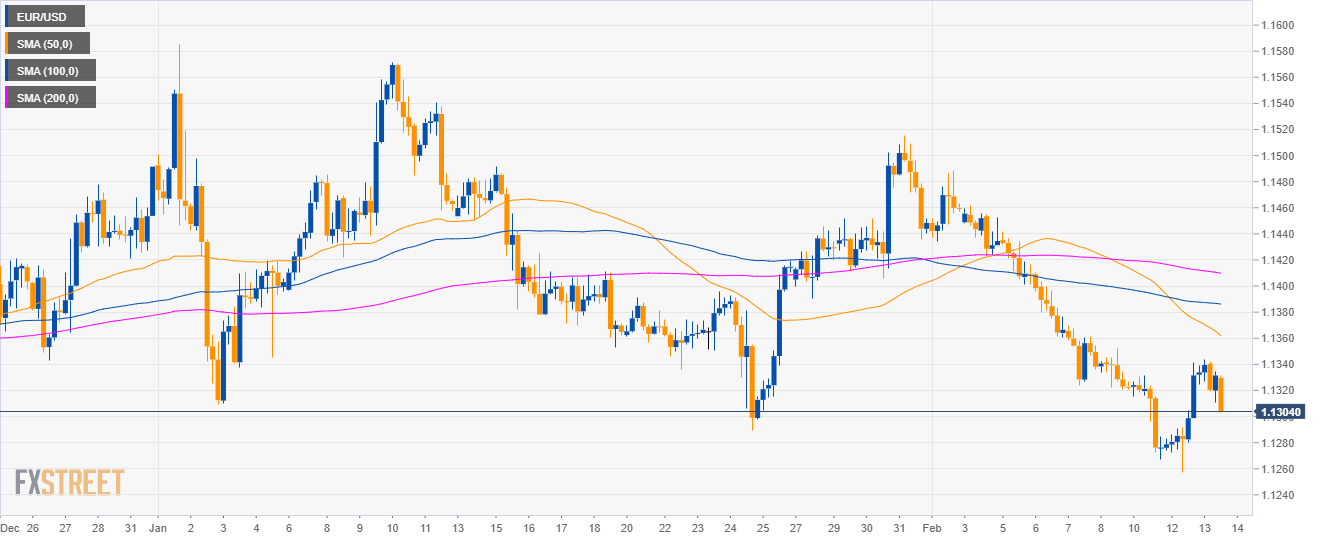
EUR/USD 4-hour chart
- EUR/USD is trading below its main SMAs suggesting bearish momentum in the medium-term.
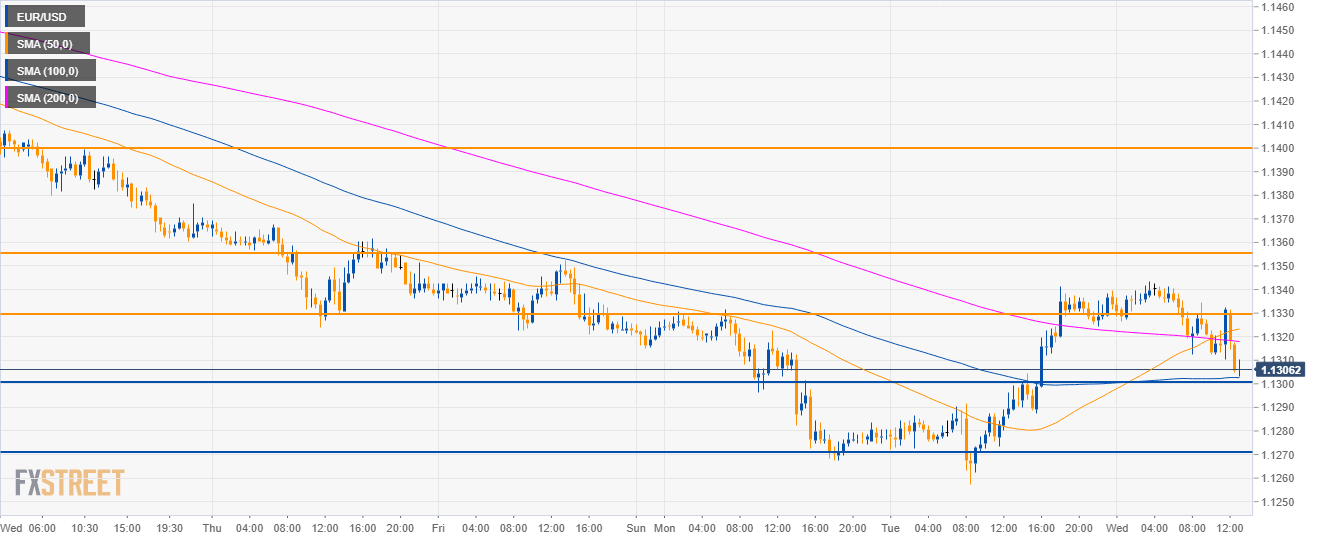
EUR/USD 30-minute chart
- EUR/USD is testing the 1.1300 figure and the 100 SMA.
- A break of 1.1300 could lead to a move down to 1.1270 in the short-term.
- To the upside, resistance is seen at 1.1330 and 1.1355 and 1.1400 figure.
Additional key levels
EUR/USD
Overview:
Today Last Price: 1.1305
Today Daily change: -27 pips
Today Daily change %: -0.24%
Today Daily Open: 1.1332
Trends:
Daily SMA20: 1.1386
Daily SMA50: 1.1398
Daily SMA100: 1.1416
Daily SMA200: 1.1538
Levels:
Previous Daily High: 1.1342
Previous Daily Low: 1.1258
Previous Weekly High: 1.1462
Previous Weekly Low: 1.132
Previous Monthly High: 1.1586
Previous Monthly Low: 1.1289
Daily Fibonacci 38.2%: 1.1309
Daily Fibonacci 61.8%: 1.129
Daily Pivot Point S1: 1.1279
Daily Pivot Point S2: 1.1226
Daily Pivot Point S3: 1.1195
Daily Pivot Point R1: 1.1363
Daily Pivot Point R2: 1.1394
Daily Pivot Point R3: 1.1447
