- The index moved higher and printed fresh 2019 highs during overnight trading in the 97.25/30 band, just to ease some pips afterwards.
- DXY thus remains poised for a visit to 2018 peaks at 97.71 recorded in late December.
- In the meantime, the constructive outlook on the buck is expected to remain intact as long as the 200-day SMA at 95.49 underpins.
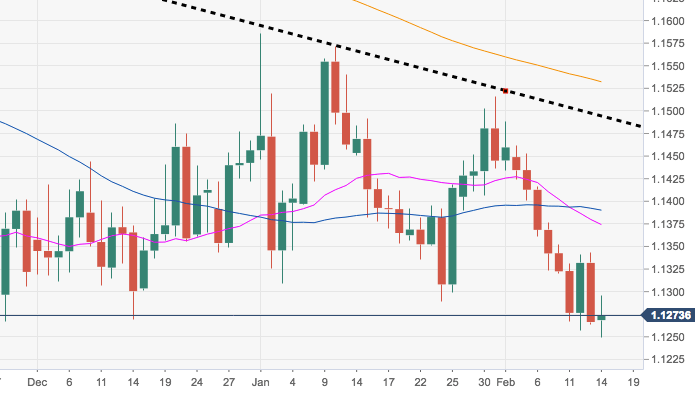
DXY daily chart
Dollar Index Spot
Overview:
Today Last Price: 97.05
Today Daily change: 20 pips
Today Daily change %: -0.14%
Today Daily Open: 97.19
Trends:
Daily SMA20: 96.21
Daily SMA50: 96.4
Daily SMA100: 96.32
Daily SMA200: 95.47
Levels:
Previous Daily High: 97.19
Previous Daily Low: 96.63
Previous Weekly High: 96.69
Previous Weekly Low: 95.58
Previous Monthly High: 96.96
Previous Monthly Low: 95.03
Daily Fibonacci 38.2%: 96.98
Daily Fibonacci 61.8%: 96.84
Daily Pivot Point S1: 96.82
Daily Pivot Point S2: 96.44
Daily Pivot Point S3: 96.26
Daily Pivot Point R1: 97.38
Daily Pivot Point R2: 97.56
Daily Pivot Point R3: 97.94
