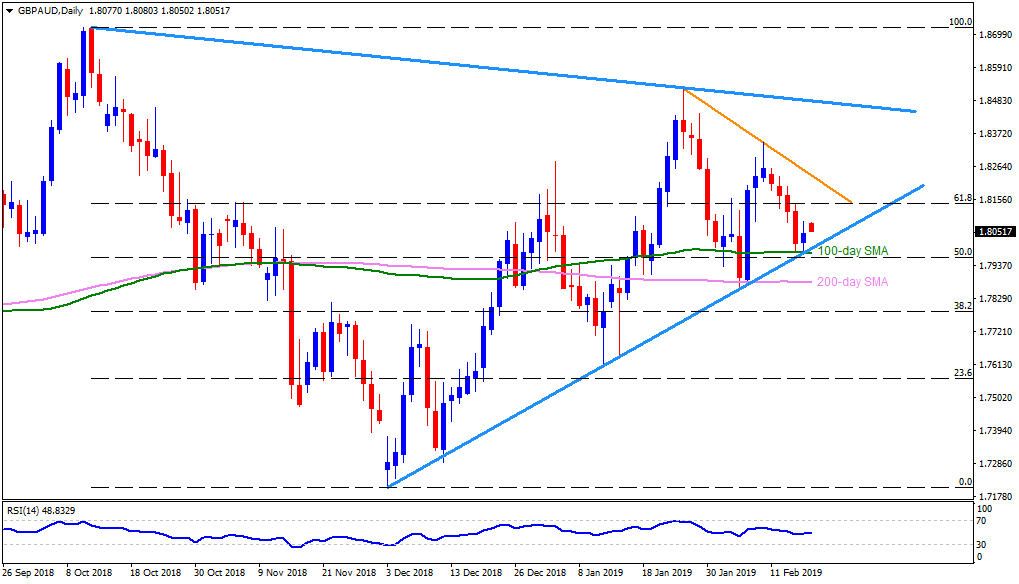
GBP/AUD daily chart
- GBP/AUD trades little changed around 1.8060 during initial Asian sessions on Monday.
- Failure to provide a clear break above Friday’s high of 1.8082 highlights the importance of ten-week old support-line, at 1.7990 now, followed by 100-day simple moving average (SMA) around 1.7980.
- In case prices slide under 1.7980, chances of witnessing a plunge to 200-day SMA level of 1.7880 can’t be denied.
- Alternatively, an upside clearance of 1.8082 could enable the buyers to aim for 1.8120 but a downward sloping trend-line, at 1.8230, might challenge them afterward.
- Given the quote’s rise above 1.8230, 1.8260 and 1.8300 should gain market attention.
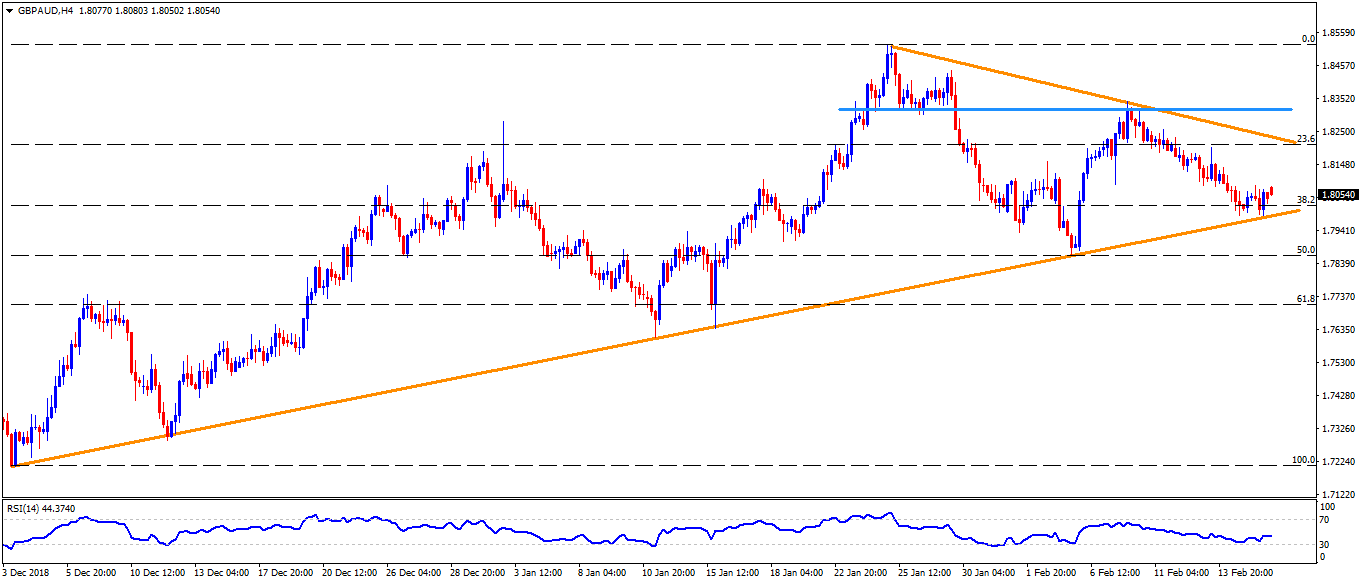
GBP/AUD 4-Hour chart
- The 23.6% Fibonacci retracement of its December to January advances, at 1.8120, can offer an intermediate halt to the pair’s rise past-1.8120 and before 1.8230.
- Also, the 1.8320 horizontal-line may please bulls after 1.8300.
- On the downside break of 1.7990, the 1.7900 may act as buffer ahead of emphasizing 1.7880 support.
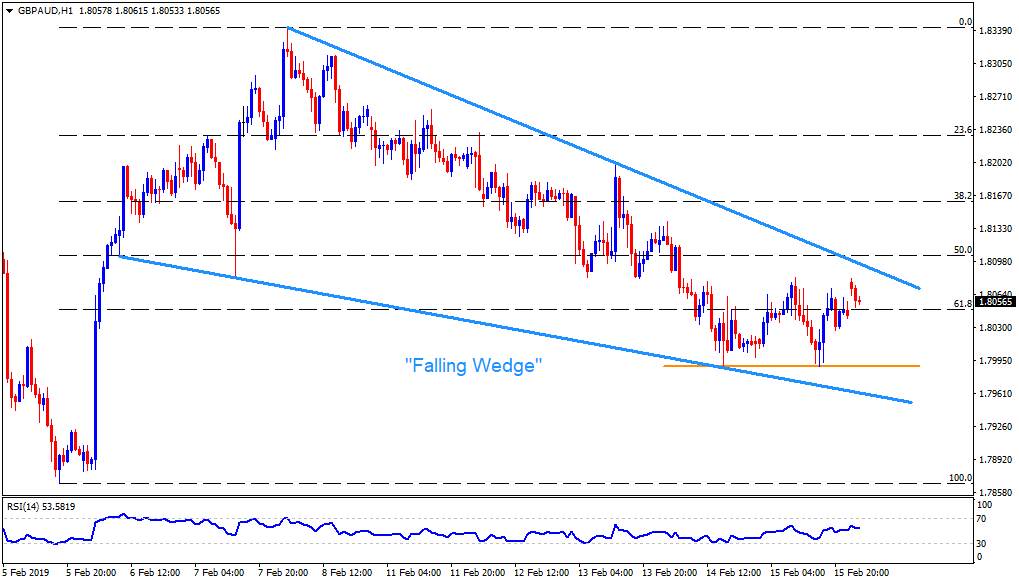
GBP/AUD hourly chart
- The GBP/AUD pair forms “falling wedge” bullish technical pattern on the hourly chart and can confirm the rise towards 1.8200 as 1.8100 breaks.
- Should the pair rallies past-1.8200, 1.8255 and 1.8310 may entertain optimists.
- Alternatively, 1.7990 could limit the pair’s immediate declines, a break of which can fetch it to 1.7940 and 1.7920 supports.