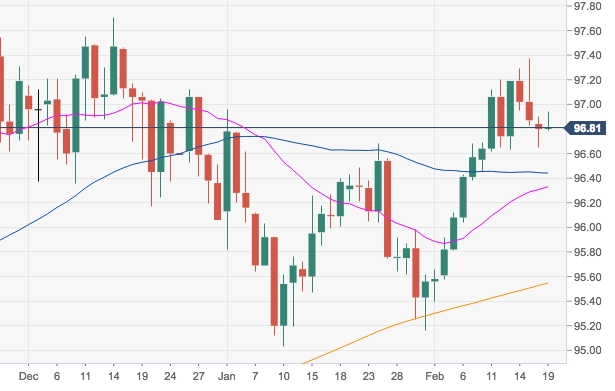
- After hitting fresh 2019 peaks in the boundaries of 97.40 at the end of last week, DXY met some selling pressure and receded to the 96.60 region, where some decent support emerged.
- A deeper pullback is expected to meet contention in the 96.41/33 zone, where coincide the 55-, 100- and 21-day SMAs.
- In the meantime, further consolidation is not ruled out in the short-term horizon, while the next target on the upside remains at yearly peaks nearly 97.35/40 band.
DXY daily chart
Dollar Index Spot
Overview:
Today Last Price: 96.79
Today Daily change: 17 pips
Today Daily change %: -0.01%
Today Daily Open: 96.8
Trends:
Daily SMA20: 96.31
Daily SMA50: 96.4
Daily SMA100: 96.39
Daily SMA200: 95.53
Levels:
Previous Daily High: 96.9
Previous Daily Low: 96.65
Previous Weekly High: 97.37
Previous Weekly Low: 96.62
Previous Monthly High: 96.96
Previous Monthly Low: 95.03
Daily Fibonacci 38.2%: 96.75
Daily Fibonacci 61.8%: 96.8
Daily Pivot Point S1: 96.67
Daily Pivot Point S2: 96.53
Daily Pivot Point S3: 96.42
Daily Pivot Point R1: 96.92
Daily Pivot Point R2: 97.03
Daily Pivot Point R3: 97.17
