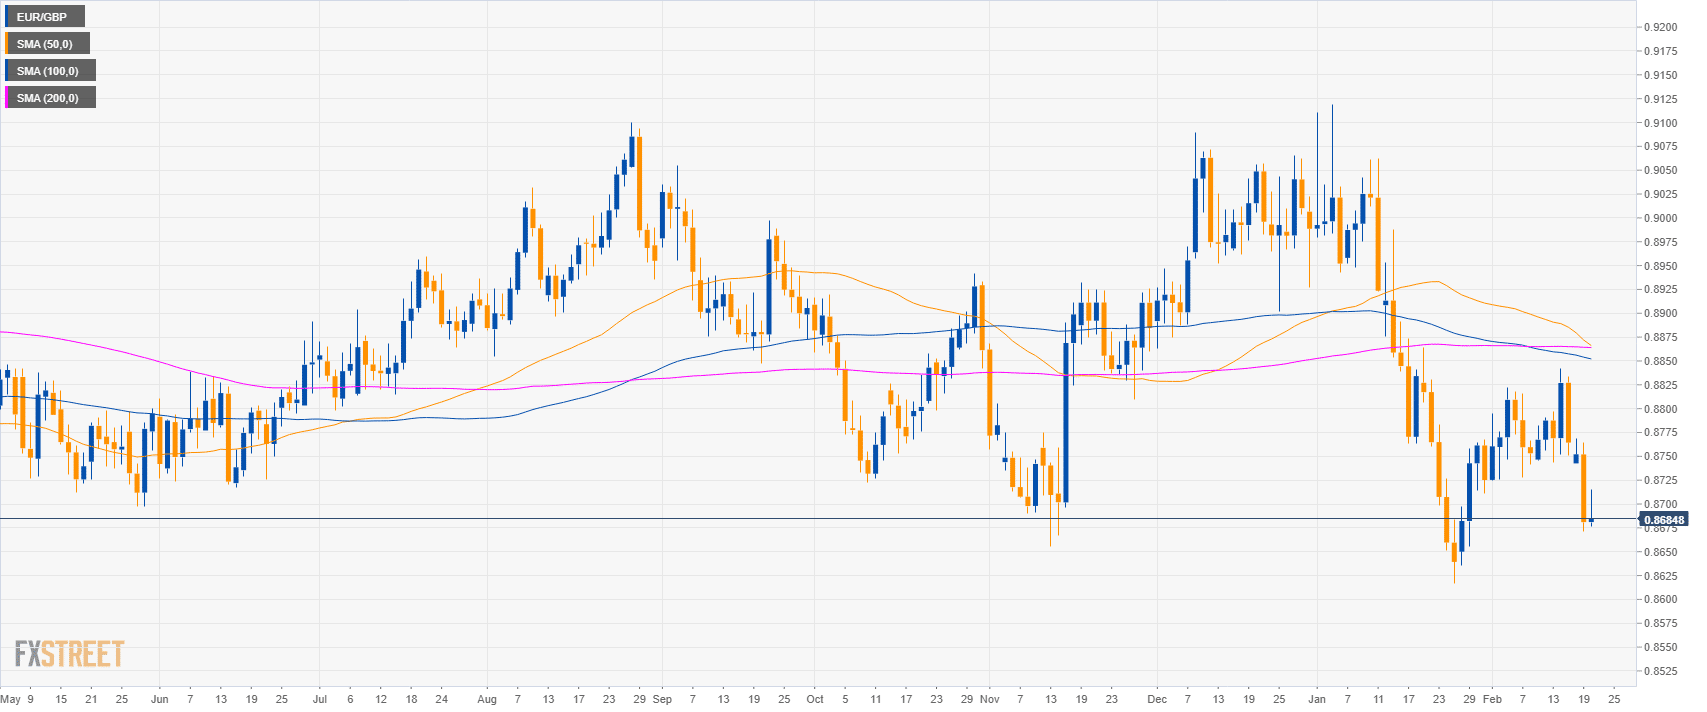
EUR/GBP daily chart
- EUR/GBP is trading in a sideways trend below the 200-day simple moving averages (SMAs).
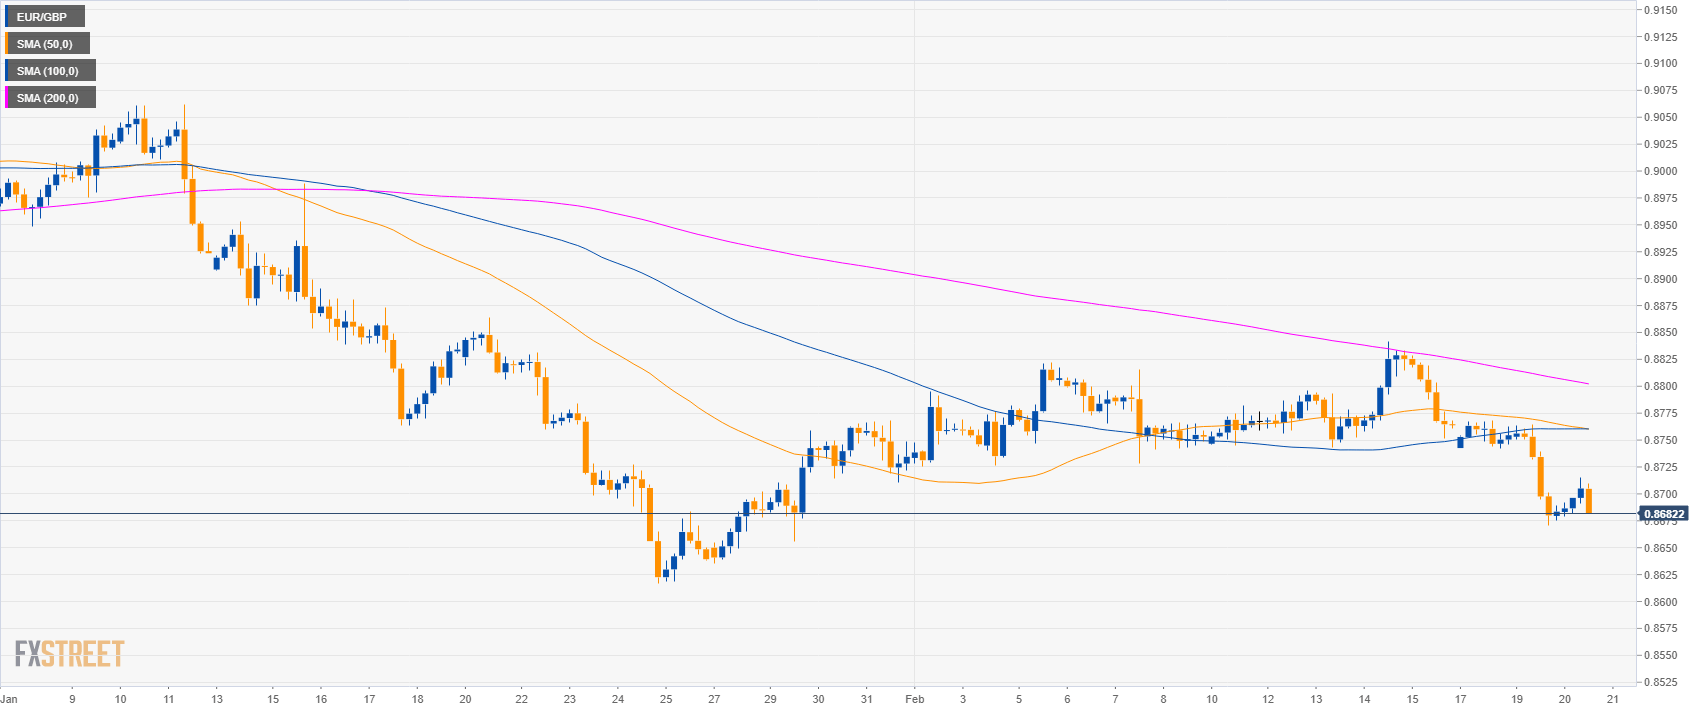
EUR/GBP 4-hour chart
- EUR/GBP is trading below the main SMAs on the 4-hour chart suggesting a bearish market in the medium-term.
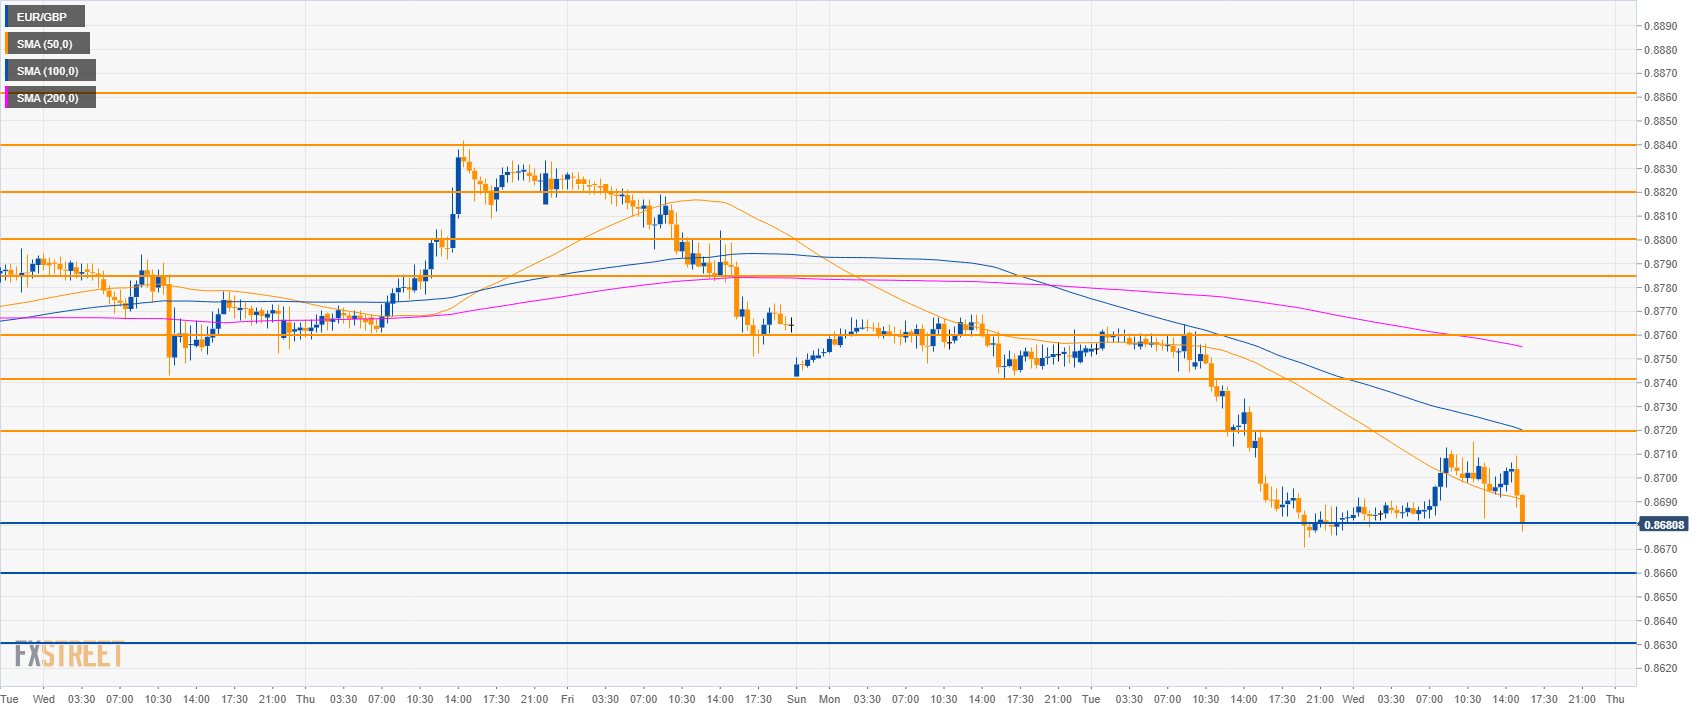
EUR/GBP 30-minute chart
- EUR/GBP is trading below the main SMAs suggesting bearish momentum in the short-term.
- EUR/GBP is testing 0.8680. A break below the level would lead to 0.8660 and 0.8630 level.
- Key resistance is seen at 0.8720 and 0.8760 level.
Additional key levels
EUR/GBP
Overview:
Today Last Price: 0.8693
Today Daily change: 12 pips
Today Daily change %: 0.14%
Today Daily Open: 0.8681
Trends:
Daily SMA20: 0.8745
Daily SMA50: 0.8872
Daily SMA100: 0.8854
Daily SMA200: 0.8864
Levels:
Previous Daily High: 0.8764
Previous Daily Low: 0.8671
Previous Weekly High: 0.8842
Previous Weekly Low: 0.8743
Previous Monthly High: 0.9119
Previous Monthly Low: 0.8617
Daily Fibonacci 38.2%: 0.8707
Daily Fibonacci 61.8%: 0.8729
Daily Pivot Point S1: 0.8647
Daily Pivot Point S2: 0.8612
Daily Pivot Point S3: 0.8553
Daily Pivot Point R1: 0.874
Daily Pivot Point R2: 0.8799
Daily Pivot Point R3: 0.8834
