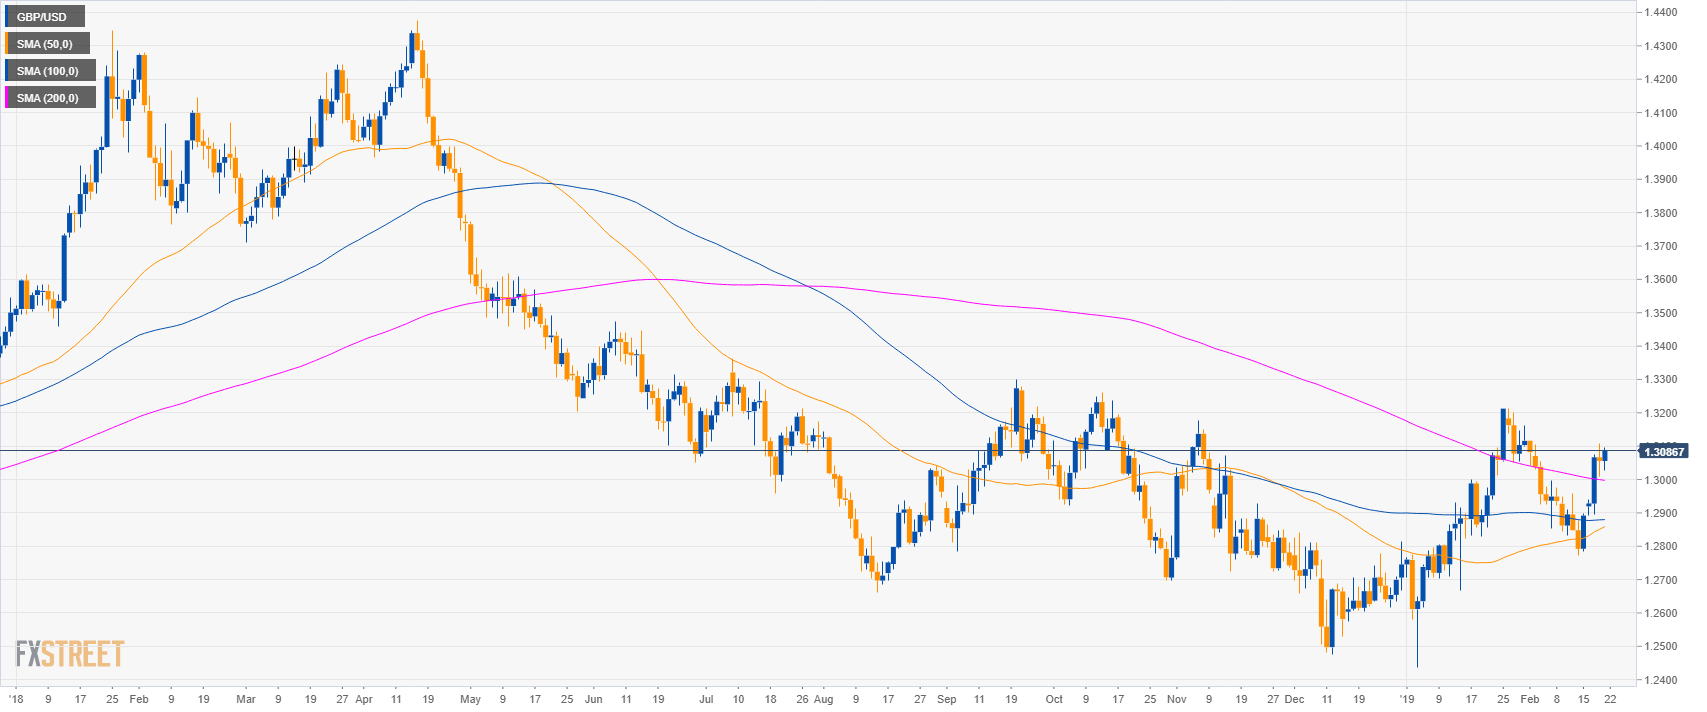
GBP/USD daily chart
- GBP/USD is trading above the 200-day simple moving average (SMA).
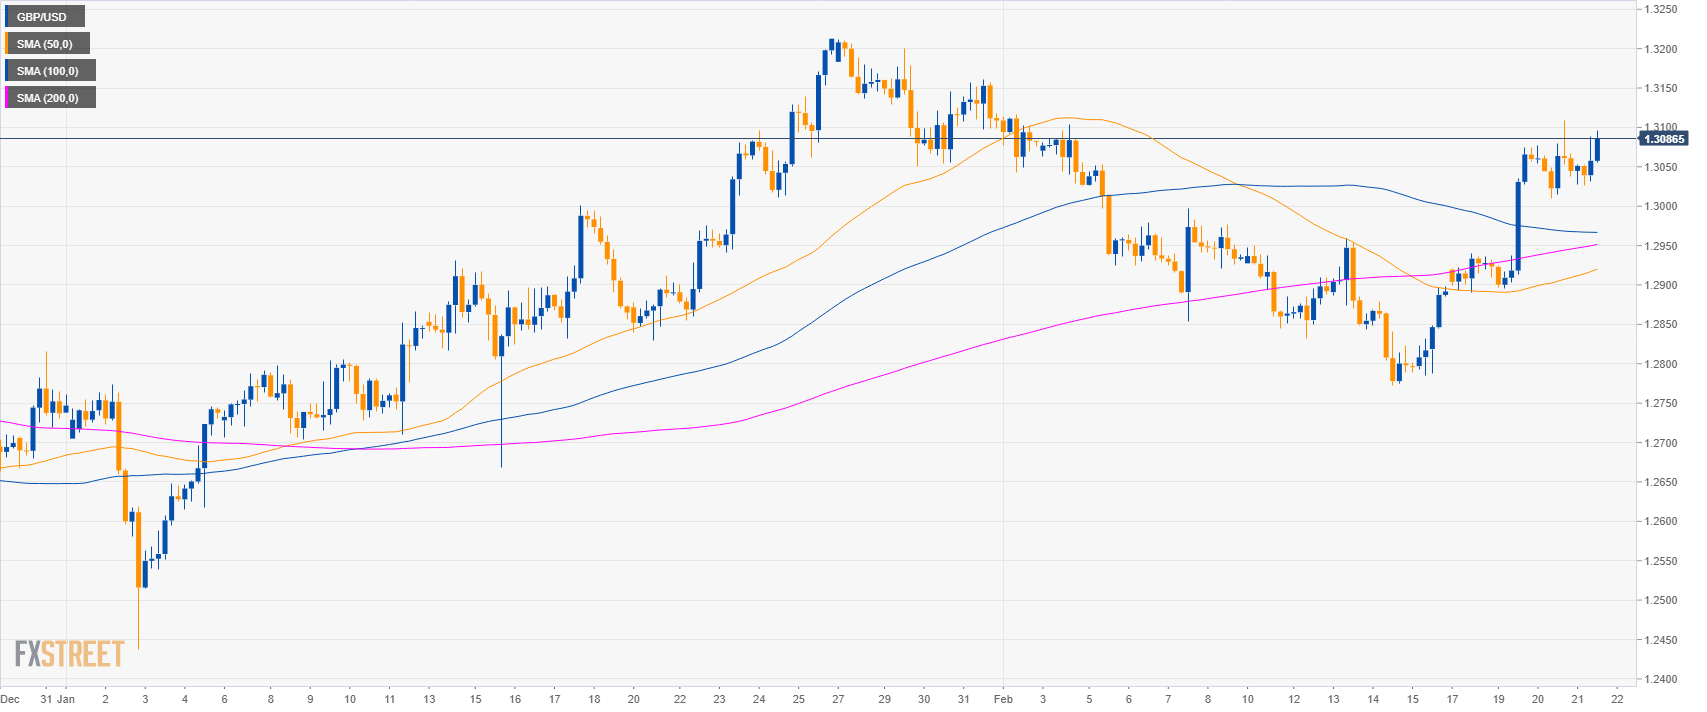
GBP/USD 4-hour chart
- GBP/USD is trading above its main SMAs suggesting a bullish bias in the medium-term.
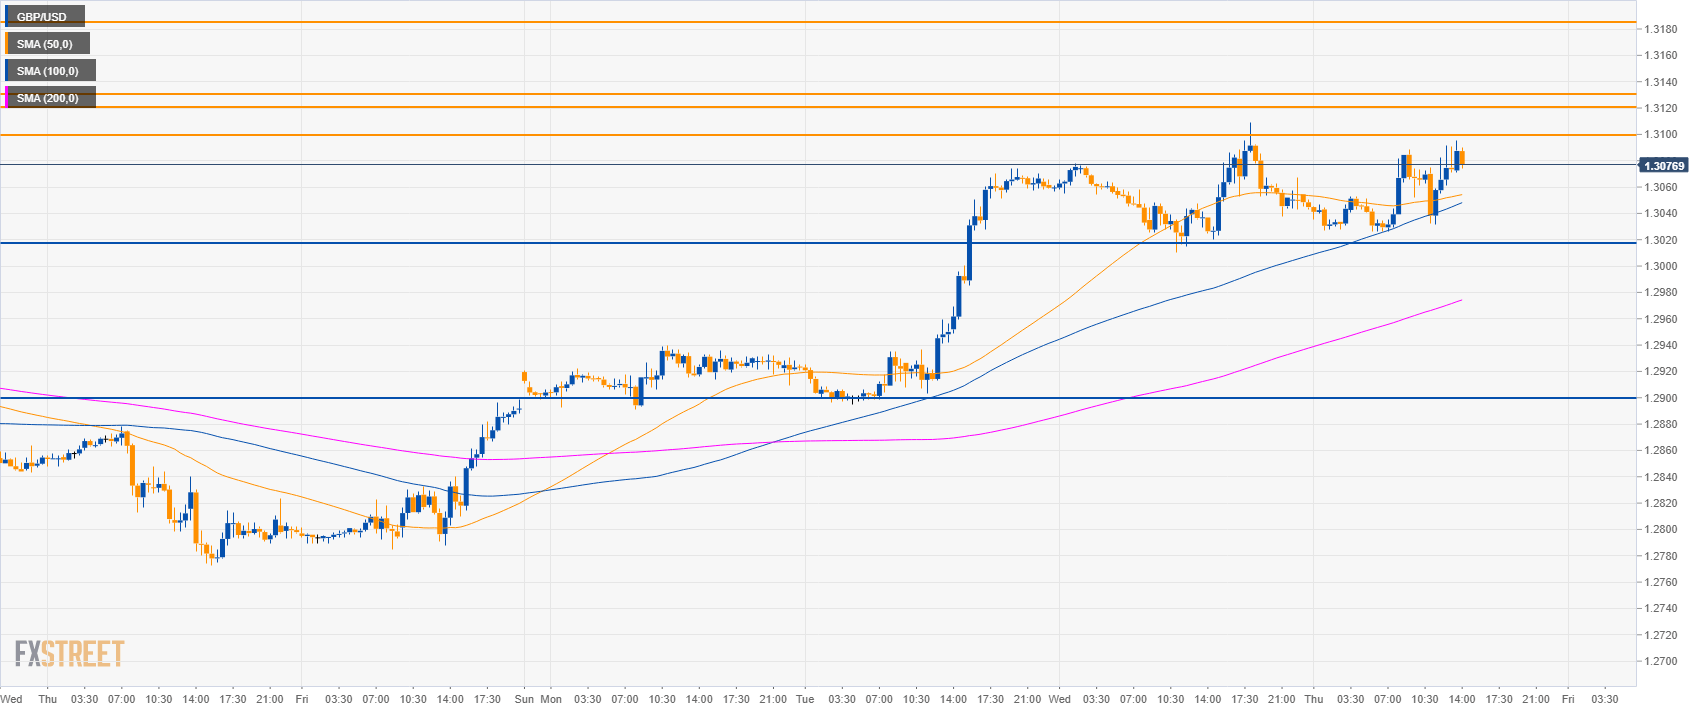
GBP/USD 30-minute chart
- GBP/USD is trading above the main SMAs suggesting a bullish bias in the short-term.
- Bulls need to break 1.3100 figure. The next bull targets are at 1.3120, 1.3135 and 1.3185 level.
- Support is at 1.3020 and 1.2900 level.
Additional key levels:
GBP/USD
Overview:
Today Last Price: 1.3087
Today Daily change: 31 pips
Today Daily change %: 0.24%
Today Daily Open: 1.3056
Trends:
Daily SMA20: 1.2998
Daily SMA50: 1.2851
Daily SMA100: 1.2879
Daily SMA200: 1.2999
Levels:
Previous Daily High: 1.3109
Previous Daily Low: 1.301
Previous Weekly High: 1.2959
Previous Weekly Low: 1.2773
Previous Monthly High: 1.3214
Previous Monthly Low: 1.2438
Daily Fibonacci 38.2%: 1.3048
Daily Fibonacci 61.8%: 1.3071
Daily Pivot Point S1: 1.3007
Daily Pivot Point S2: 1.2959
Daily Pivot Point S3: 1.2908
Daily Pivot Point R1: 1.3107
Daily Pivot Point R2: 1.3158
Daily Pivot Point R3: 1.3206
