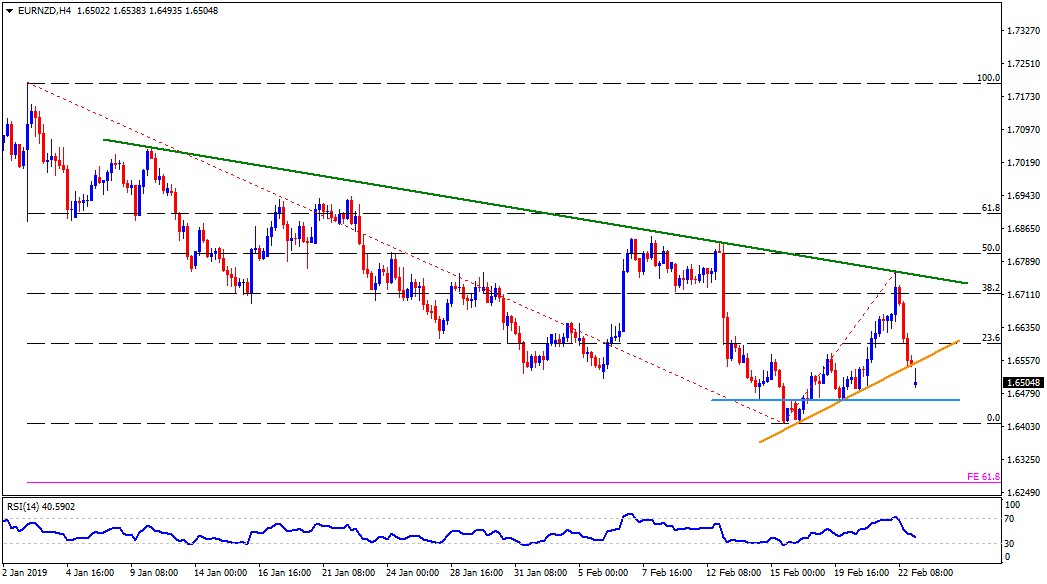
- The EUR/NZD pair trades around 1.6500 on early Monday.
- The pair began the day’s trading by slipping under a weeklong ascending support-line, which in-turn highlights the importance of 1.6460 horizontal-supoprt comprising lows marked on February 14 and 20.
- Should the prices refrain to respect 1.6460, the current month low around 1.6410 may sellers’ attention as break of which may drag the quote to 61.8% Fibonacci expansion of its January-February moves, at 1.6270 now.
- In case the pair takes a U-turn from present levels, it needs to surpass the support-turned-resistance at 1.6560 in order to visit 23.6% Fibonacci retracement of recent downturn, around 1.6600.
- During the pair’s successful trading past-1.6600, the 1.6670 and the 38.2% Fibonacci retracement at 1.6715 may act as intermediate halts ahead of pushing buyers towards six-week long resistance-line, at 1.6765.
- It should also be noted that the pair’s rise above 1.6765 enables it to aim for 1.6850 and 1.6940 prior to confronting the 1.7000 round-figure.
EUR/NZD 4-Hour chart
EUR/NZD
Overview:
Today Last Price: 1.6507
Today Daily change: -0.0049 pips
Today Daily change %: -0.30%
Today Daily Open: 1.6556
Trends:
Daily SMA20: 1.6627
Daily SMA50: 1.6784
Daily SMA100: 1.6895
Daily SMA200: 1.7064
Levels:
Previous Daily High: 1.6772
Previous Daily Low: 1.6543
Previous Weekly High: 1.6772
Previous Weekly Low: 1.6415
Previous Monthly High: 1.7247
Previous Monthly Low: 1.6529
Daily Fibonacci 38.2%: 1.663
Daily Fibonacci 61.8%: 1.6685
Daily Pivot Point S1: 1.6475
Daily Pivot Point S2: 1.6395
Daily Pivot Point S3: 1.6246
Daily Pivot Point R1: 1.6704
Daily Pivot Point R2: 1.6853
Daily Pivot Point R3: 1.6933
