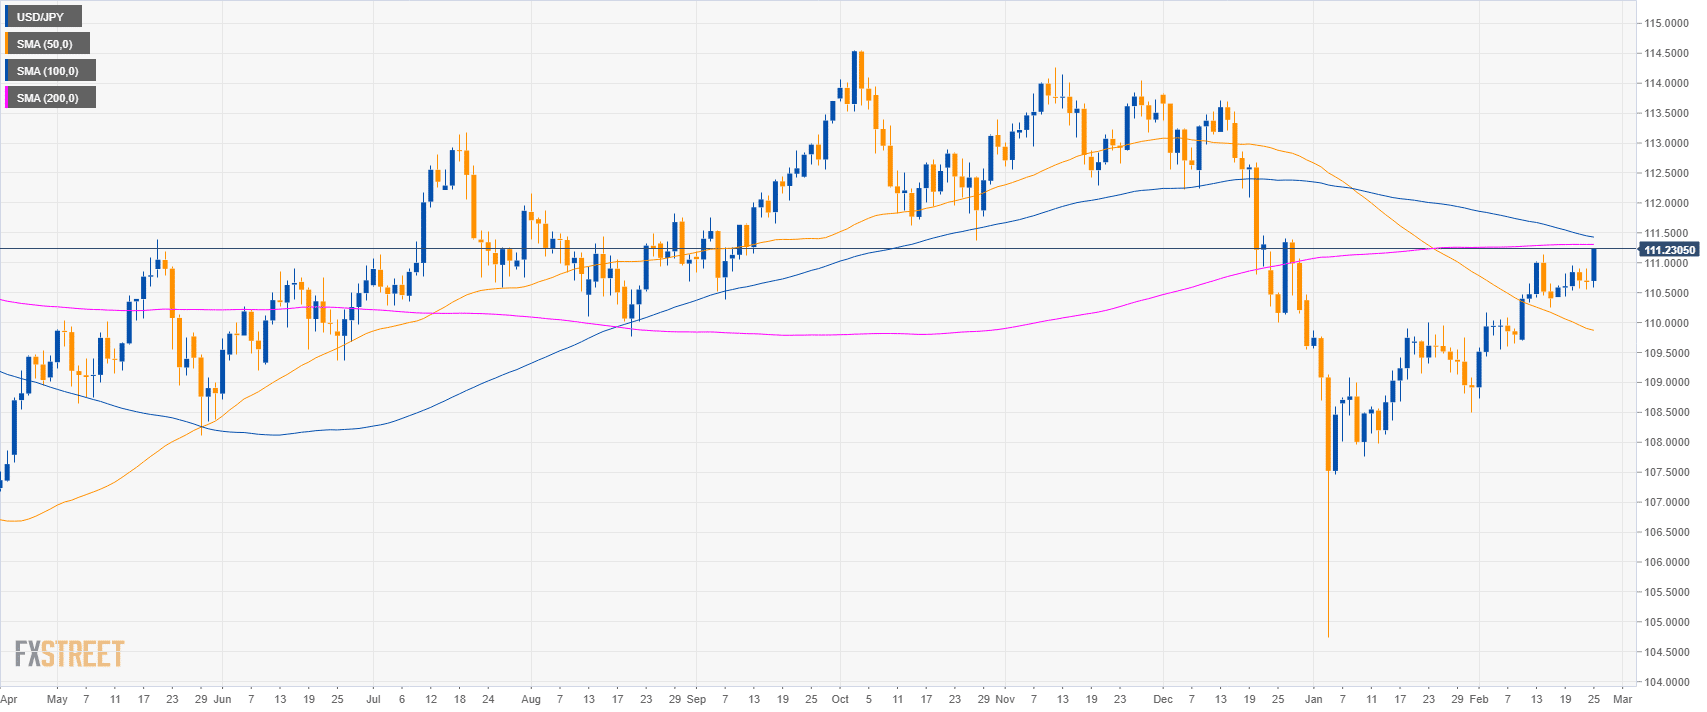
USD/JPY daily chart
- USD/JPY is trading just below the 200-day simple moving average (SMA).
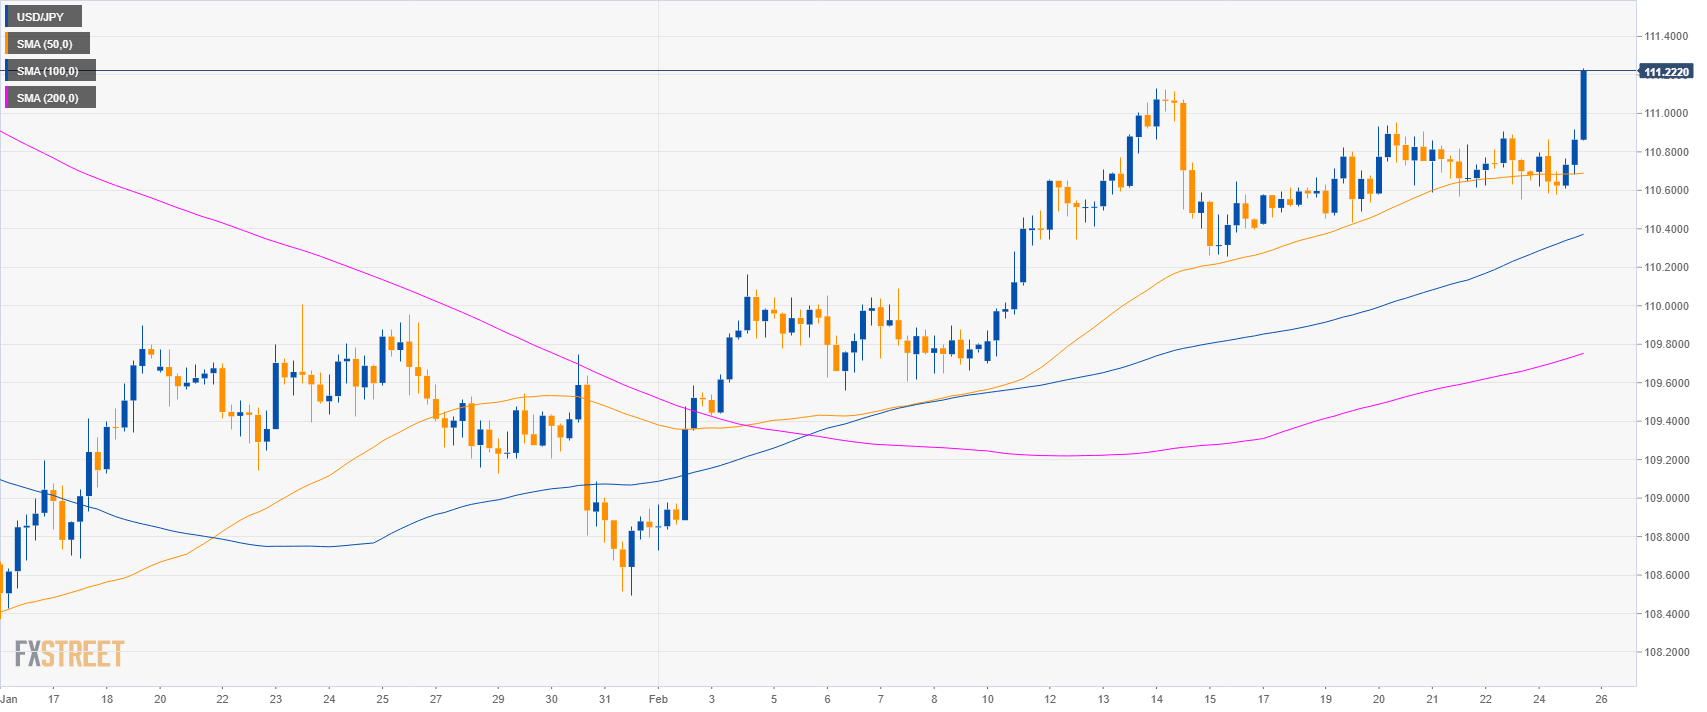
USD/JPY 4-hour chart
- USD/JPY is trading above its main SMAs suggesting bullish momentum in the medium-term.
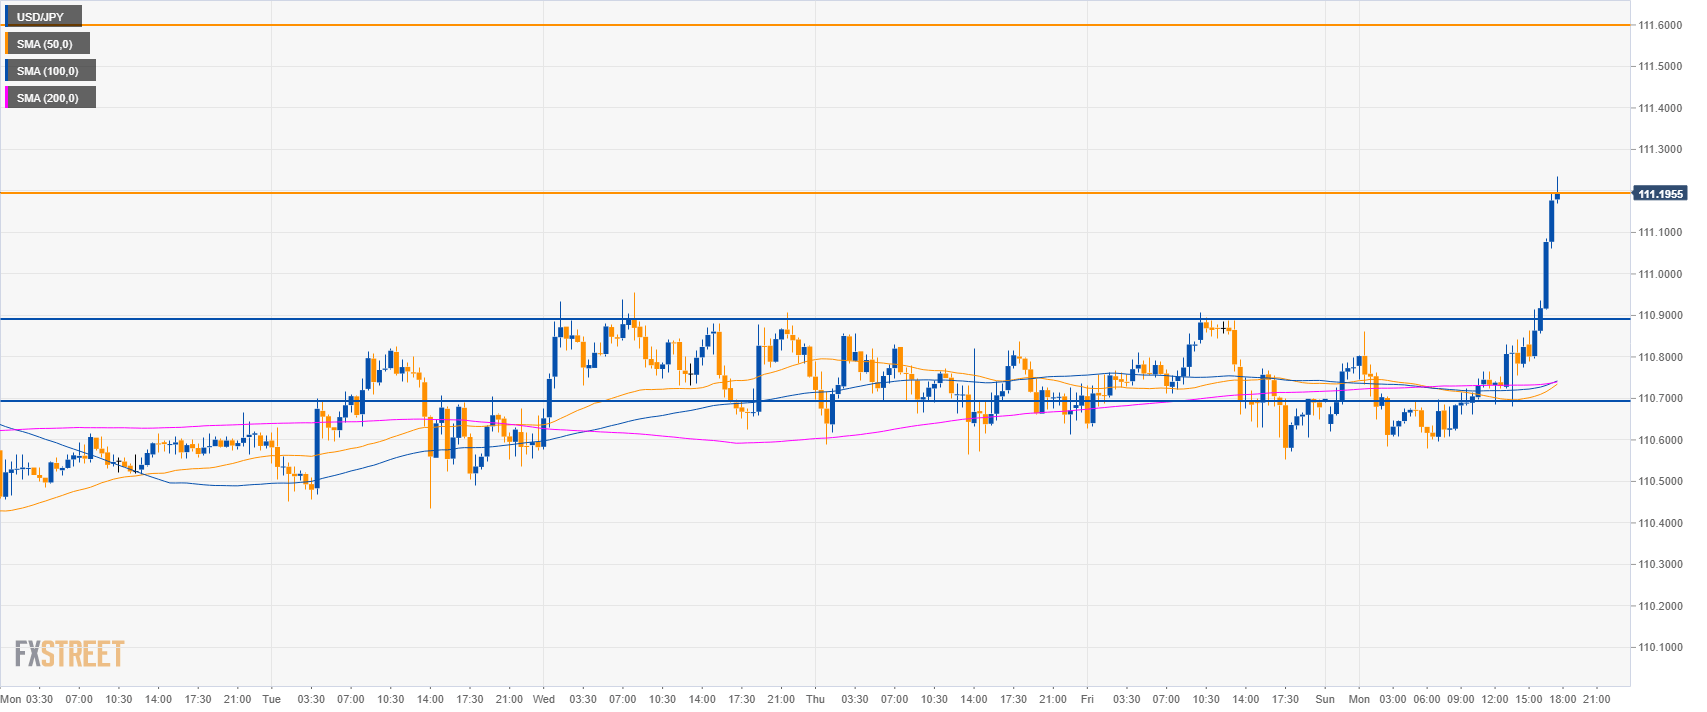
USD/JPY 30-minute chart
- USD/JPY is trading above its main SMAs suggesting bullish momentum in the short-term.
- Bulls need to close above 111.20 resistance on a daily closing basis to reach 111.60 to the upside.
- Support can be seen at 110.90 and 110.70 level.
Additional key levels
USD/JPY
Overview:
Today Last Price: 111.22
Today Daily change: 54 pips
Today Daily change %: 0.49%
Today Daily Open: 110.68
Trends:
Daily SMA20: 110.09
Daily SMA50: 109.9
Daily SMA100: 111.45
Daily SMA200: 111.31
Levels:
Previous Daily High: 110.91
Previous Daily Low: 110.55
Previous Weekly High: 110.96
Previous Weekly Low: 110.42
Previous Monthly High: 110
Previous Monthly Low: 104.75
Daily Fibonacci 38.2%: 110.69
Daily Fibonacci 61.8%: 110.77
Daily Pivot Point S1: 110.52
Daily Pivot Point S2: 110.36
Daily Pivot Point S3: 110.17
Daily Pivot Point R1: 110.87
Daily Pivot Point R2: 111.07
Daily Pivot Point R3: 111.23
