- USD/JPY trades around 111.00 during initial Asian trading on Tuesday.
- The pair registered flash 2019 high on Monday and is positive so far during today.
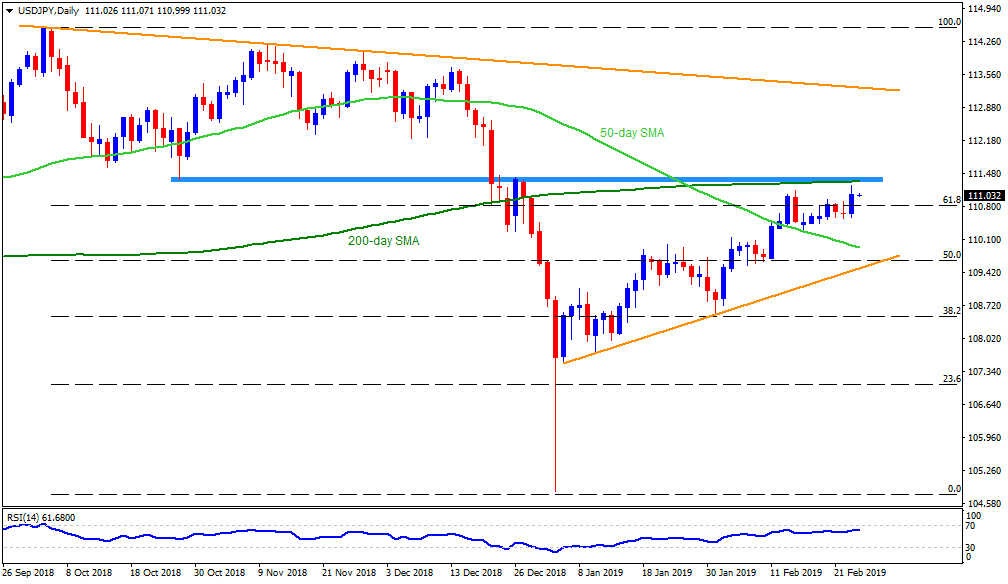
- The 14-day relative strength index (RSI) is gradually increasing and optimism surrounding the US-China trade deal may help the pair to extend its upside momentum.
- However, the 111.30/40 region, comprising 200-day simple moving average (SMA) and highs marked during late-December coupled with October lows, could become crucial resistance for the bulls to conquer.
- Should the pair crosses 111.40, 111.60 and 111.80 may offer intermediate halts ahead of visiting 112.00 round-figure.
- Additionally, pair’s extended rise over 112.00 might not hesitate to challenge 112.20 and 112.80 numbers to the north.
- Meanwhile, 110.90, 110.50 and 110.30 are likely nearby supports to follow during the pair’s pullback ahead of highlighting the 50-day SMA level of 109.90.
- In a case prices slide under 109.90, an upward sloping support-line stretched since early January, at 109.50, could become crucial to watch.
USD/JPY daily chart
Additional important levels:
Overview:
Today Last Price: 111.05
Today Daily change: 37 pips
Today Daily change %: 0.33%
Today Daily Open: 110.68
Trends:
Daily SMA20: 110.09
Daily SMA50: 109.9
Daily SMA100: 111.45
Daily SMA200: 111.31
Levels:
Previous Daily High: 110.91
Previous Daily Low: 110.55
Previous Weekly High: 110.96
Previous Weekly Low: 110.42
Previous Monthly High: 110
Previous Monthly Low: 104.75
Daily Fibonacci 38.2%: 110.69
Daily Fibonacci 61.8%: 110.77
Daily Pivot Point S1: 110.52
Daily Pivot Point S2: 110.36
Daily Pivot Point S3: 110.17
Daily Pivot Point R1: 110.87
Daily Pivot Point R2: 111.07
Daily Pivot Point R3: 111.23
