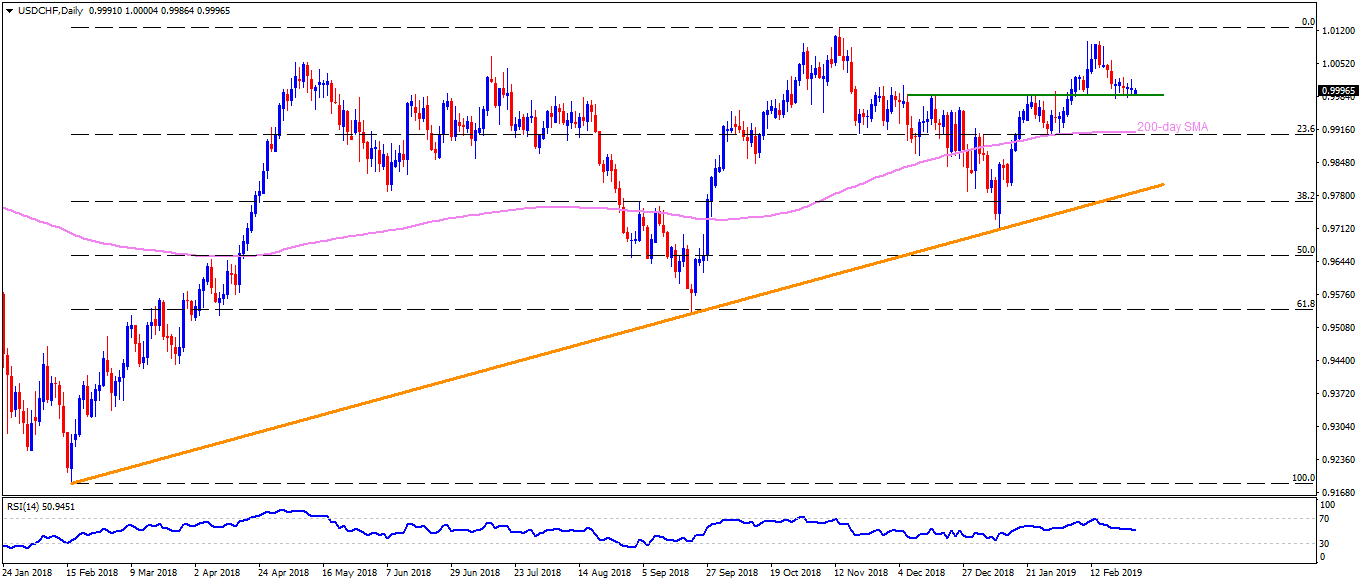
USD/CHF daily chart
- USD/CHF trades near 0.9995 during early Asian sessions on Wednesday.
- The pair repeatedly refrains from declining below 0.9985-80 support-line connecting recent lows to the highs marked during early December and January.
- With the frequent bounce off 0.9985-80, chances of the pair rise towards 1.0060 are much brighter on the successful break of 1.0025 nearby resistance.
- During the pair’s rise past-1.0060, 1.0100 and 1.0125 may gain buyers’ attention
- If at all the pair slips under 0.9980, 0.9950 and 200-day simple moving average (SMA) at 0.9910 can act as immediate supports.
- Additionally, 0.9845, 0.9800 and an upward sloping support-line joining lows marked during a year’s time at 0.9780 can try limiting the pair’s declines after 0.9910.
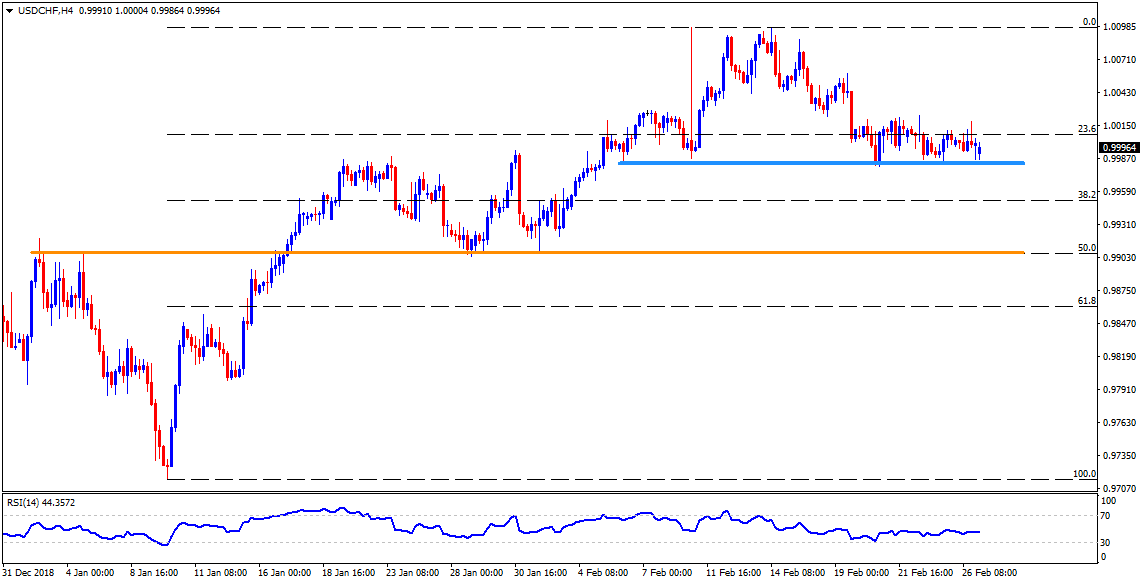
USD/CHF 4-Hour chart
- In order to validate the pair’s slide under 200-day SMA, 50% Fibonacci retracement of January-February upside, at 0.9905, becomes necessary.
- Also, 1.0080 can act as a buffer during the pair’s rise towards 1.0100 and after crossing 1.0060 resistance.
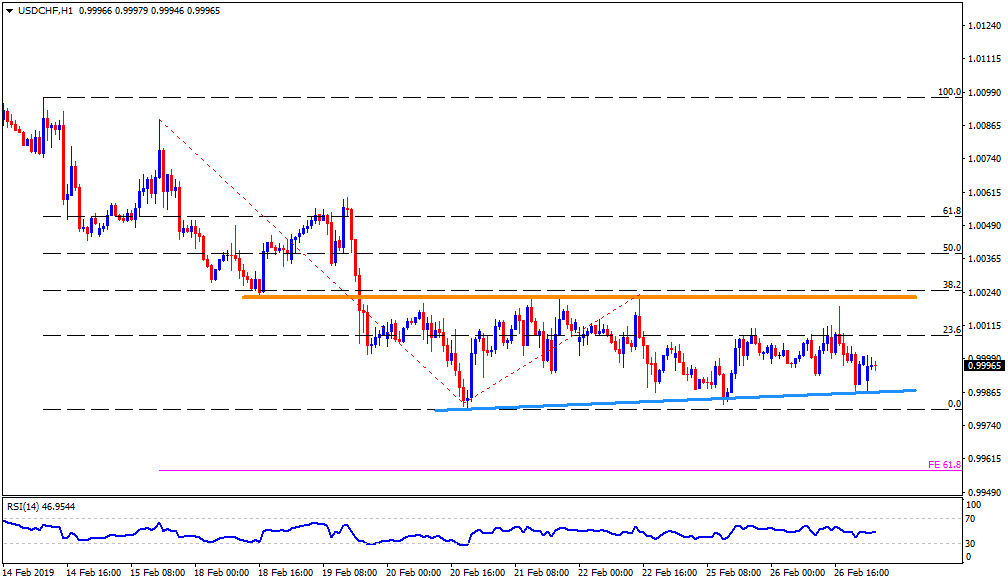
USD/CHF hourly chart
- On the H1 chart, 0.9990 seems adjacent support before requiring the pair to slip beneath 0.9980 in order to aim for 61.8% Fibonacci expansion (FE) of its moves since mid-February, at 0.9960.
- Also, 1.0010 may try challenging short-term buyers ahead of offering them the 1.0025 and the 1.0060 levels to cherish.