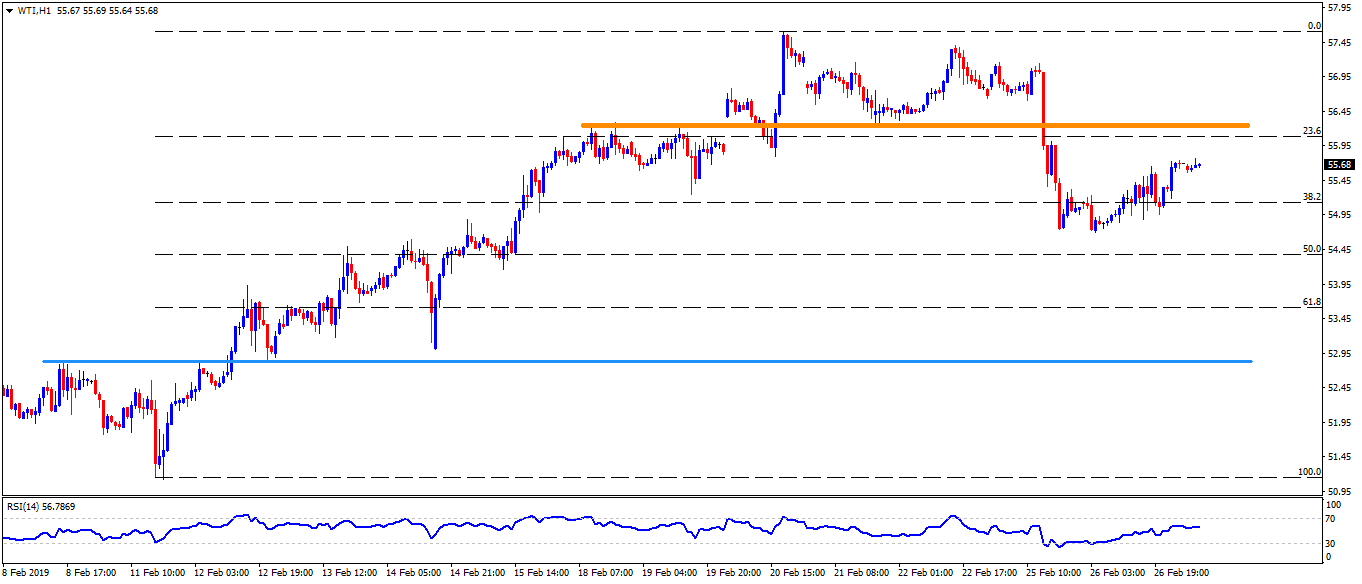
WTI daily chart
- WTI struggles with $55.70 while heading towards European open on Wednesday.
- 100-day simple moving average (SMA) seems restricting the energy benchmark’s upside around $55.70 at the moment, a break of which can propel it to $56.20 and then towards $57.20-30 region including highs marked during mid-November and recently.
- In case prices rally beyond $57.30, $57.60, $59.20 and $60.00 are likely following numbers to appear on buyers’ radar.
- Alternatively, an upward sloping support-line at $54.30 can serve as nearby strong rest.
- Given the quote’s dip beneath $54.30, $53.00 and 50-day SMA level of $51.60 can please sellers.
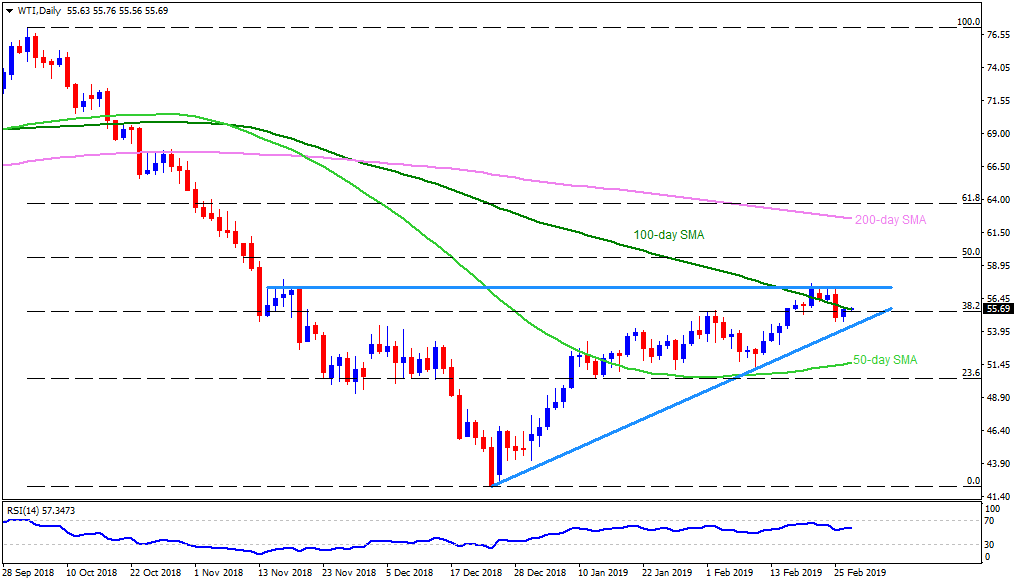
WTI 4-Hour chart
- Looking closely on the H4 chart reveals that there prevail two stops between $57.60 and $59.00. They are an upward sloping resistance-line at $58.40 and 61.8% Fibonacci expansion of recent moves, at $58.65.
- Also, $54.00 and $52.80 are likely additional supports to watch.
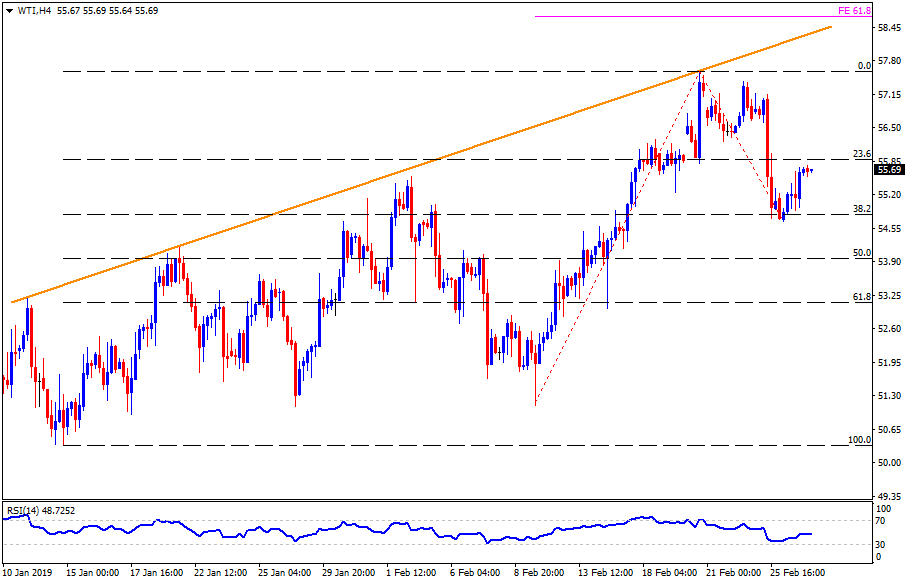
WTI hourly chart
- Other than $56.20, $57.00 becomes an extra upside stop.
- Meanwhile, $54.65 and $53.70 may entertain bears with extra stops on the downside.