- AUD/JPY trades near 79.35 after the release of China’s Caixin Manufacturing PMI on early Friday.
- The February month private gauge of manufacturing purchasing managers’ index (PMI) came in at 49.9 versus 48.5 market forecast in February. The PMI registered 48.3 level in January.
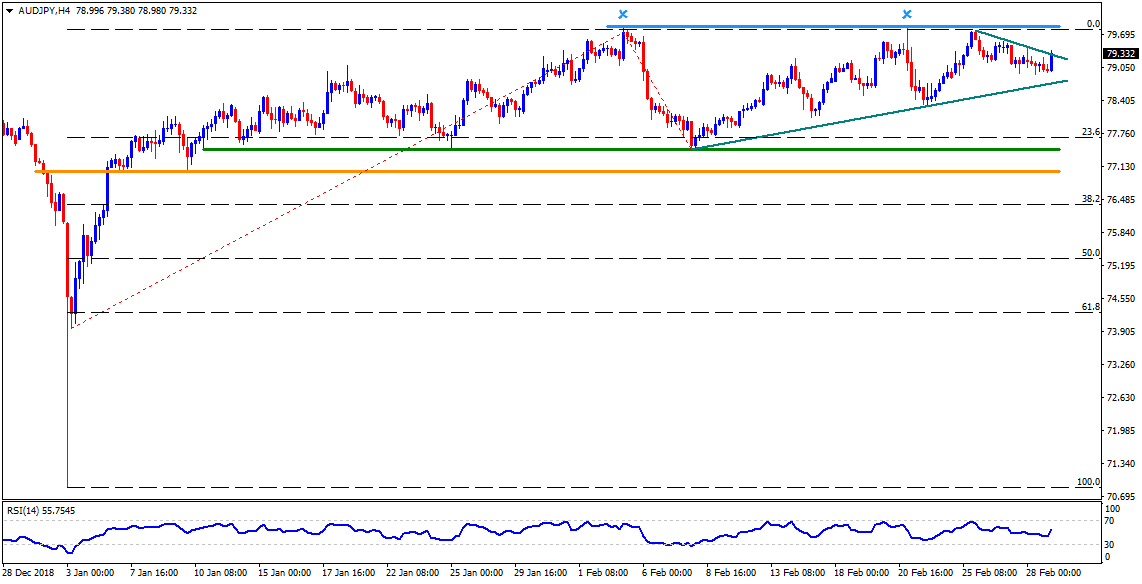
- Should the pair sustains the 79.35 break, it can aim for 79.60 while 79.80-85 region including highs marked during the month can challenge buyers then after.
- During the pair’s rise above 79.85, 61.8% Fibonacci expansion (FE) of its early January – February moves at 81.00 could become Bulls’ favorite.
- On the flipside, a support-line joining lows of February 08 and 21 may limit the pair’s immediate declines at 78.70, a break of which can drag it to 78.25 and 78.00.
- If at all bears keep ruling the sentiment after 78.00. horizontal supports around 77.40 and 77.00 could gain market attention.
AUD/JPY 4-Hour chart
Additional important levels:
Overview:
Today Last Price: 79.19
Today Daily change: 12 pips
Today Daily change %: 0.15%
Today Daily Open: 79.07
Trends:
Daily SMA20: 78.87
Daily SMA50: 78.31
Daily SMA100: 79.81
Daily SMA200: 80.76
Levels:
Previous Daily High: 79.47
Previous Daily Low: 78.93
Previous Weekly High: 79.82
Previous Weekly Low: 78.33
Previous Monthly High: 79.85
Previous Monthly Low: 77.44
Daily Fibonacci 38.2%: 79.14
Daily Fibonacci 61.8%: 79.27
Daily Pivot Point S1: 78.84
Daily Pivot Point S2: 78.62
Daily Pivot Point S3: 78.3
Daily Pivot Point R1: 79.38
Daily Pivot Point R2: 79.7
Daily Pivot Point R3: 79.92
