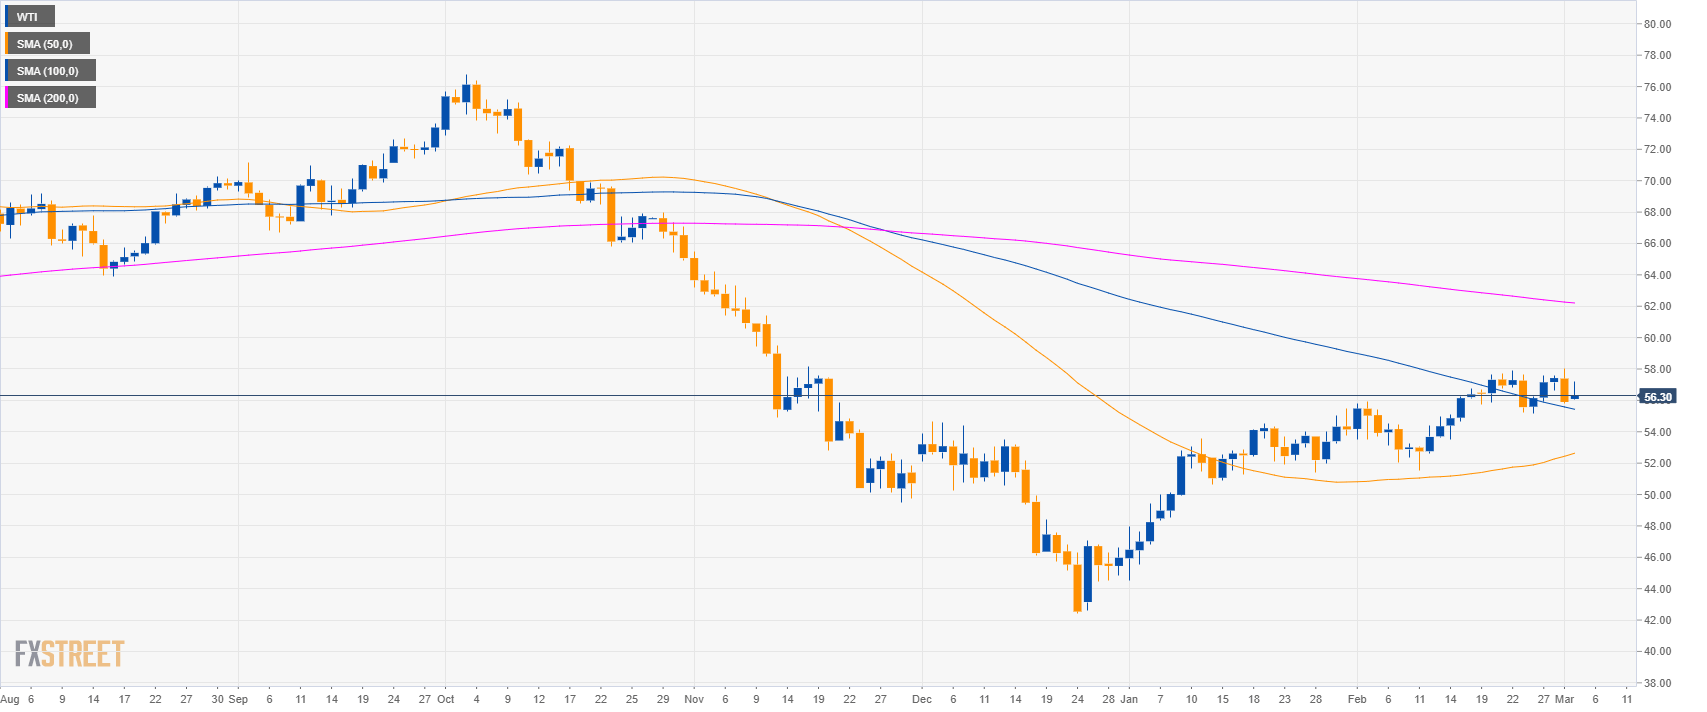
Oil daily chart
- Oil is trading above the 50 and 100-day simple moving averages (SMAs) suggesting a mild bullish bias.
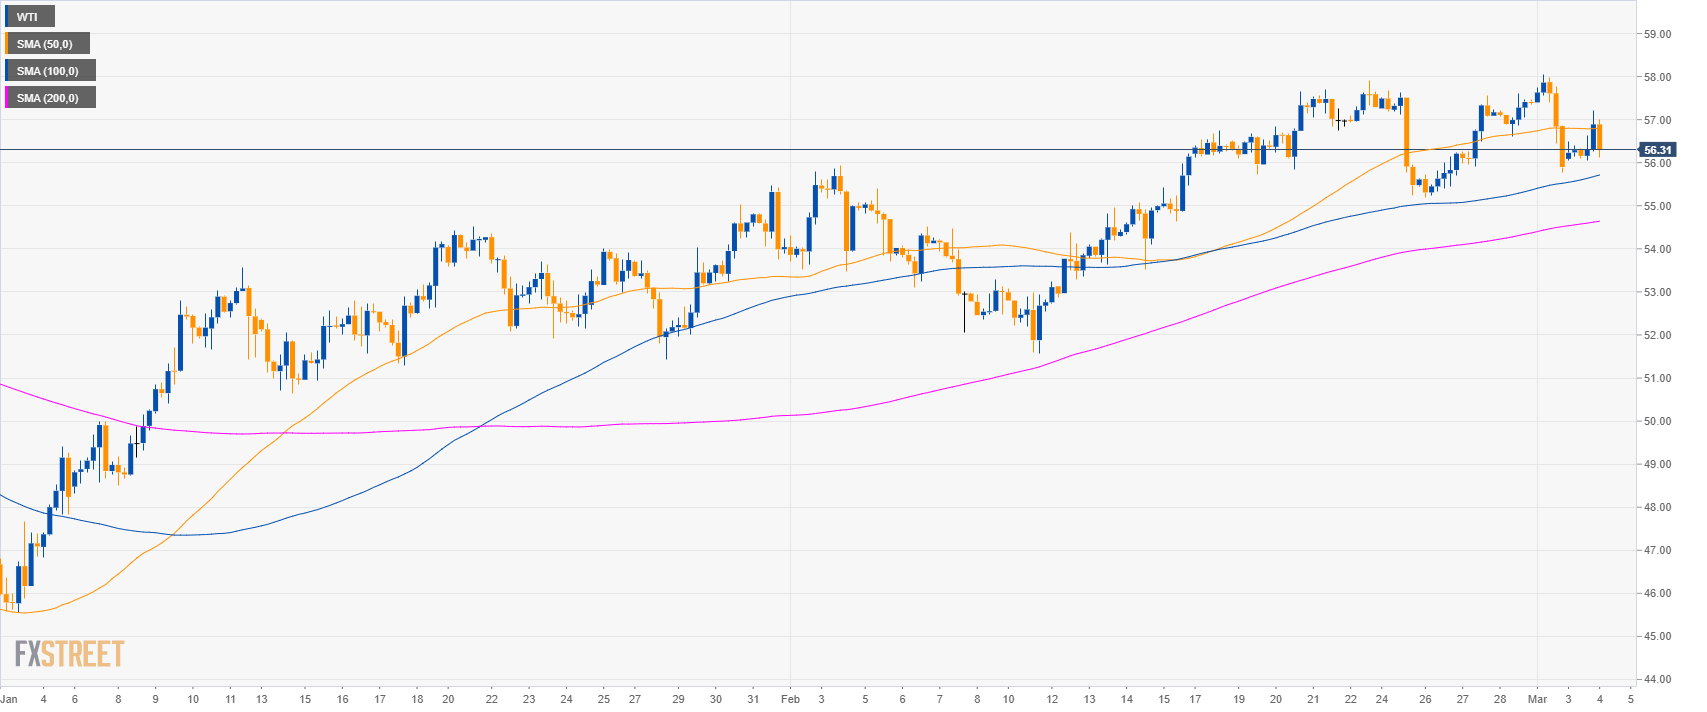
Oil 4-hour chart
- Crude oil WTI rejected the 50 SMA suggesting a potential pullback down in the medium-term.
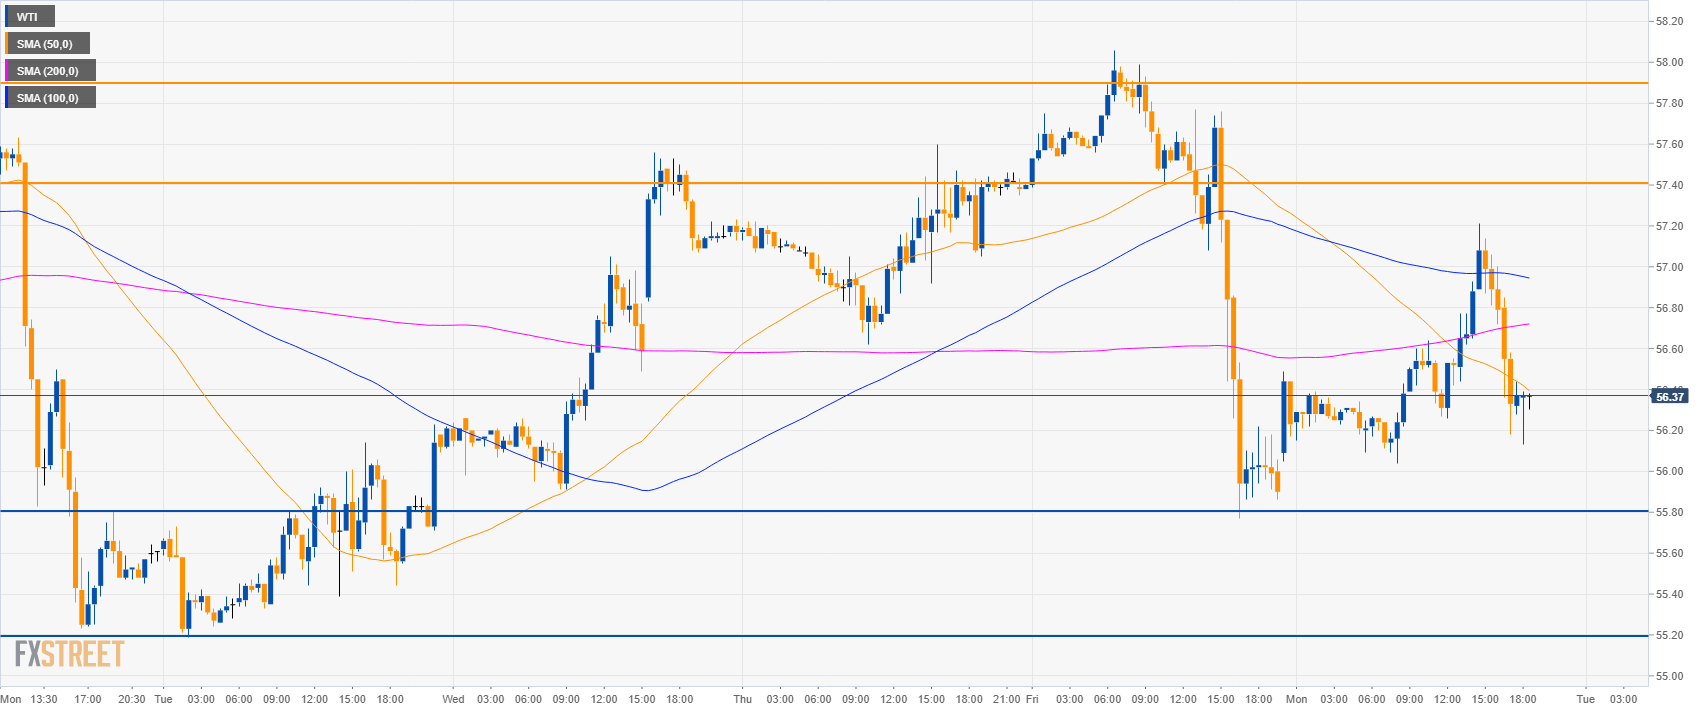
Oil 30-minute chart
- WTI is trading below its main SMAs suggesting bearish momentum as the bears virtually erased gains made previously in the day.
- Support is at 55.80 and 55.20 and 54.80 level.
- Resistances to the upside are at 57.40 and 57.90 level.
Additional key levels
WTI
Overview:
Today Last Price: 56.37
Today Daily change: 47 ticks
Today Daily change %: 0.84%
Today Daily Open: 55.9
Trends:
Daily SMA20: 55.37
Daily SMA50: 52.55
Daily SMA100: 54.5
Daily SMA200: 62.31
Levels:
Previous Daily High: 58.06
Previous Daily Low: 55.77
Previous Weekly High: 58.06
Previous Weekly Low: 55.19
Previous Monthly High: 57.92
Previous Monthly Low: 51.56
Daily Fibonacci 38.2%: 56.64
Daily Fibonacci 61.8%: 57.19
Daily Pivot Point S1: 55.09
Daily Pivot Point S2: 54.29
Daily Pivot Point S3: 52.8
Daily Pivot Point R1: 57.38
Daily Pivot Point R2: 58.87
Daily Pivot Point R3: 59.67
