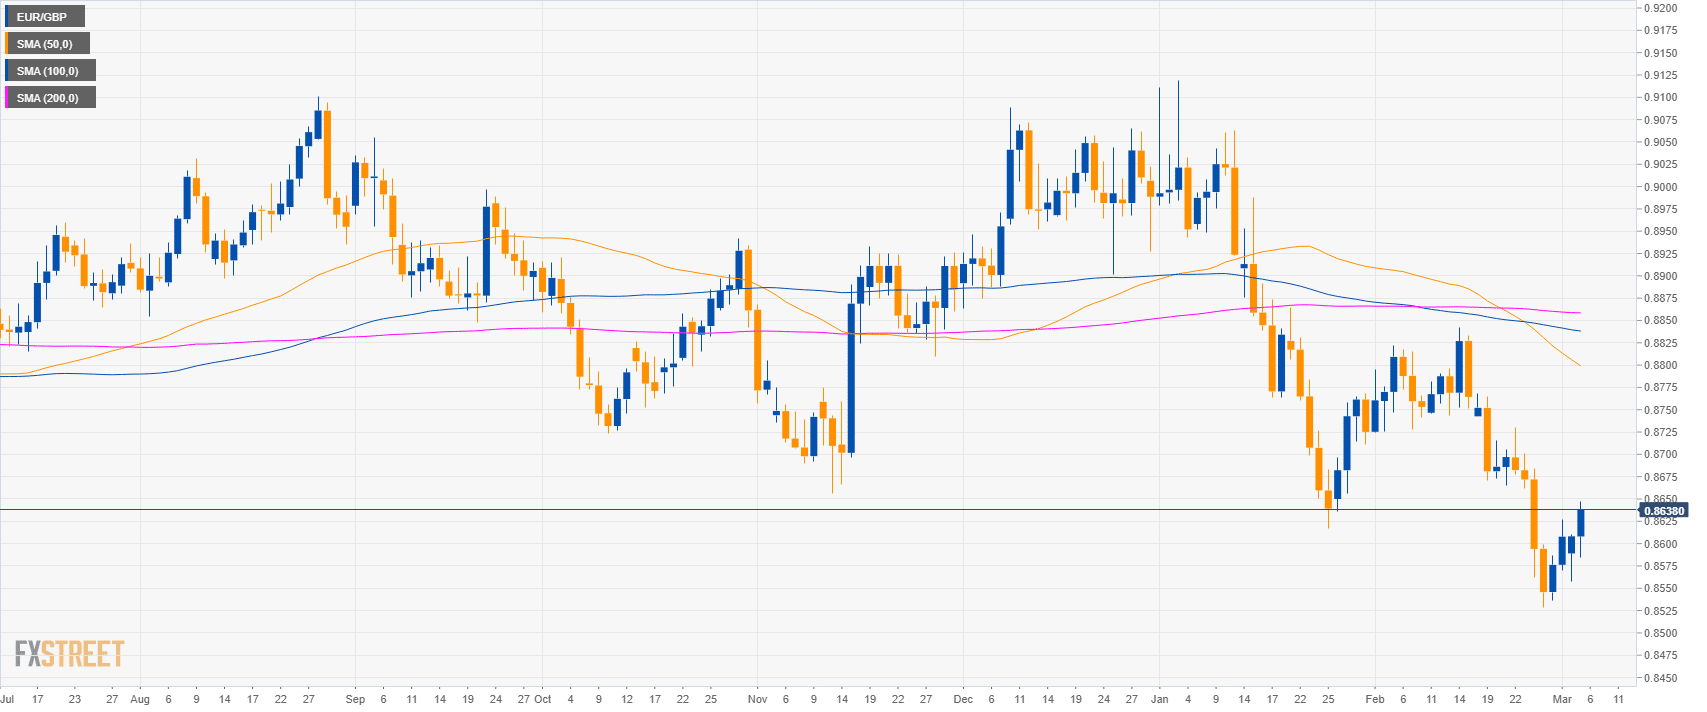
EUR/GBP daily chart
- EUR/GBP is trading in a sideways trend below its main simple moving averages (SMAs).
- As discussed, EUR/GBP hit the 0.8630 level to the upside.
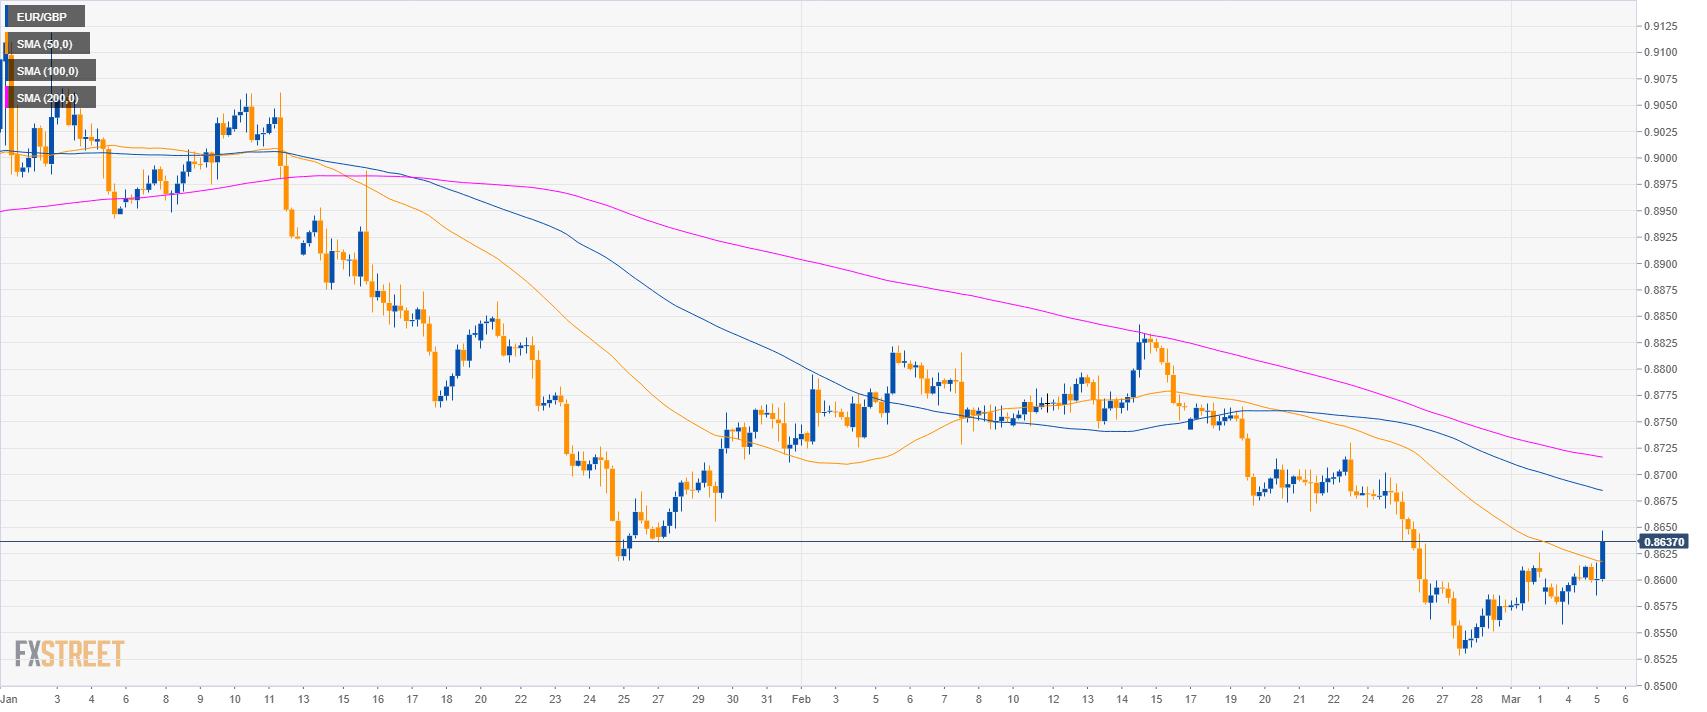
EUR/GBP 4-hour chart
- EUR/GBP is trading between the 50 and 100 SMAs suggesting a consolidation phase in the medium-term.
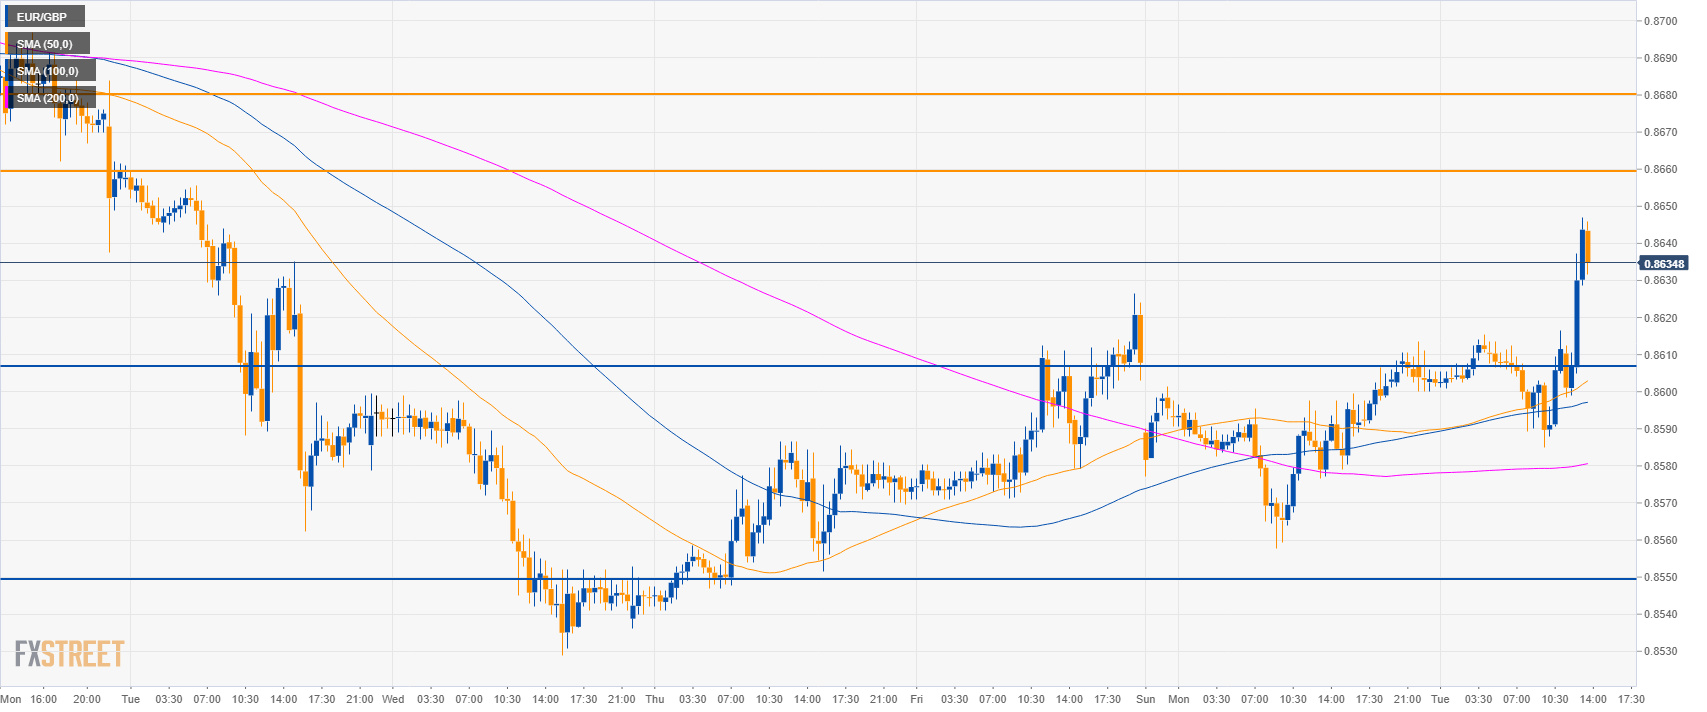
EUR/GBP 30-minute chart
- EUR/GBP is trading above its main SMAs suggesting bullish momentum.
- Resistances to the upside are at 0.8660 and 0.8680 level.
- Support is at 0.8650 and 0.8550 level.
Additional key levels
EUR/GBP
Overview:
Today Last Price: 0.8637
Today Daily change: 29 pips
Today Daily change %: 0.34%
Today Daily Open: 0.8608
Trends:
Daily SMA20: 0.8706
Daily SMA50: 0.8806
Daily SMA100: 0.884
Daily SMA200: 0.8859
Levels:
Previous Daily High: 0.861
Previous Daily Low: 0.8558
Previous Weekly High: 0.8702
Previous Weekly Low: 0.8529
Previous Monthly High: 0.8842
Previous Monthly Low: 0.8529
Daily Fibonacci 38.2%: 0.859
Daily Fibonacci 61.8%: 0.8578
Daily Pivot Point S1: 0.8574
Daily Pivot Point S2: 0.8539
Daily Pivot Point S3: 0.8521
Daily Pivot Point R1: 0.8627
Daily Pivot Point R2: 0.8645
Daily Pivot Point R3: 0.8679
