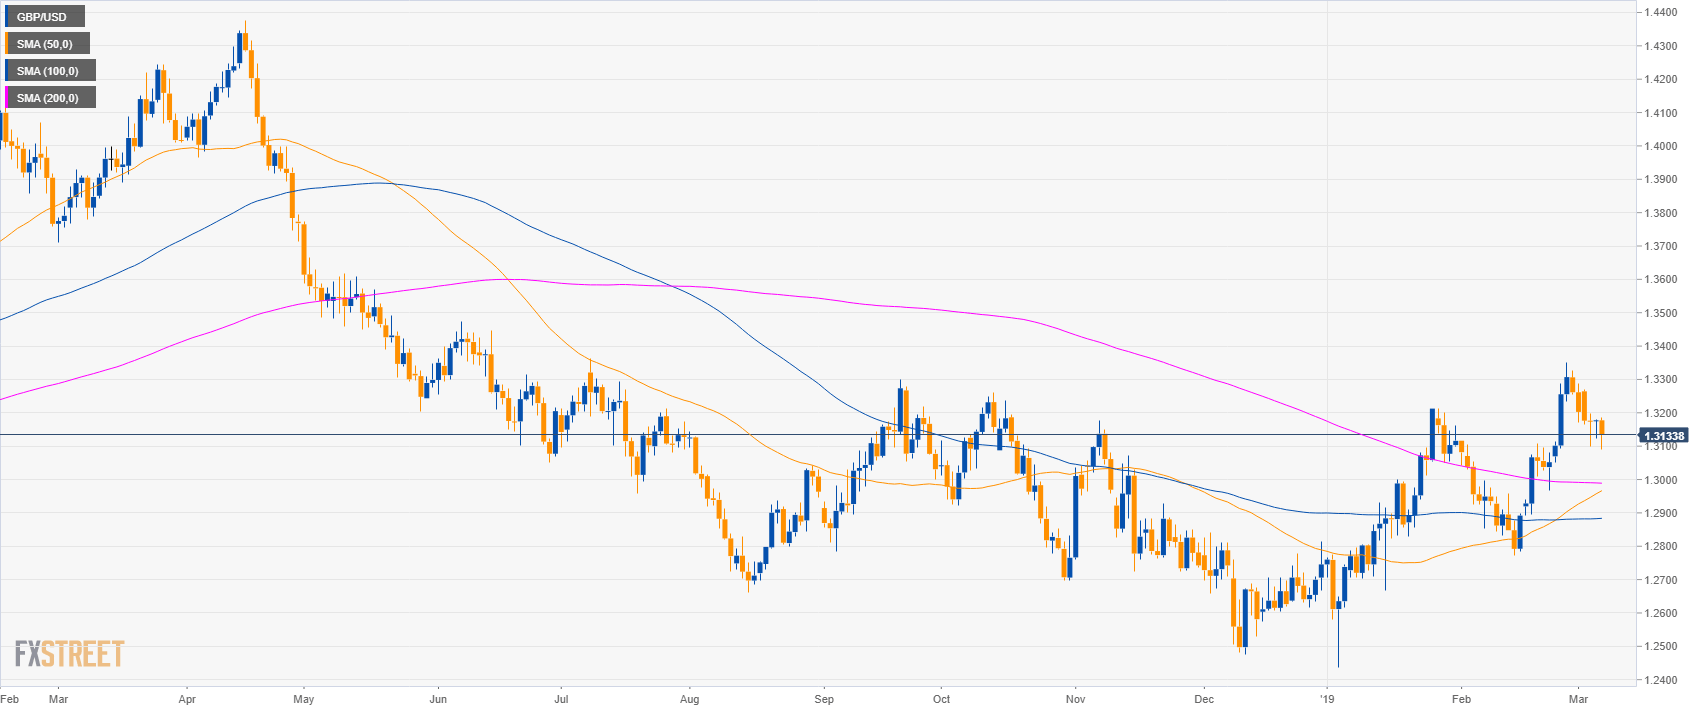
GBP/USD daily chart
- GBP/USD is evolving in a bull leg above its main simple moving averages.
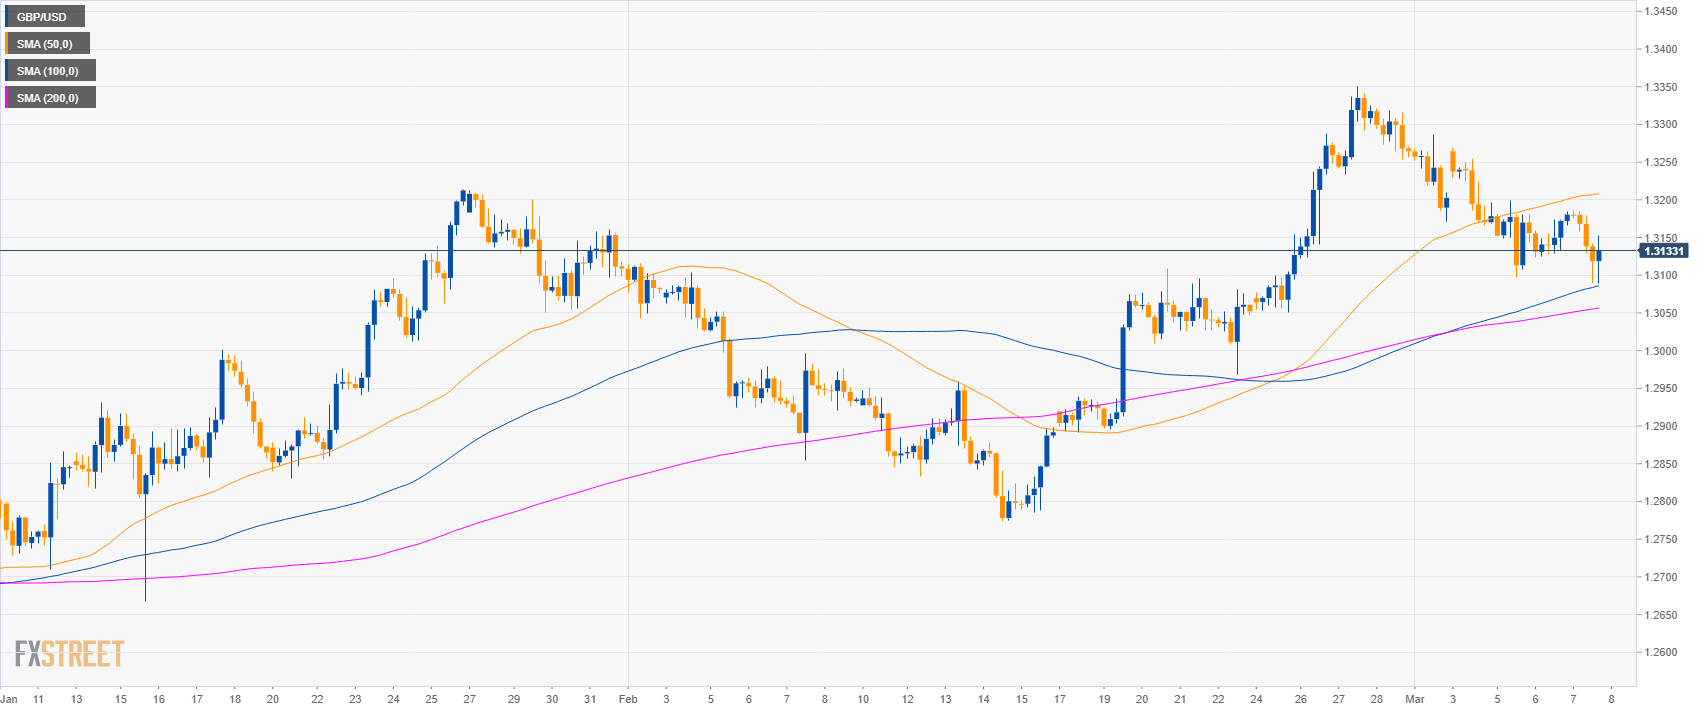
GBP/USD 4-hour chart
- GBP/USD is testing the 100 SMA but is trading below the 50 SMA, suggesting a mild bullish bias in the medium-term.
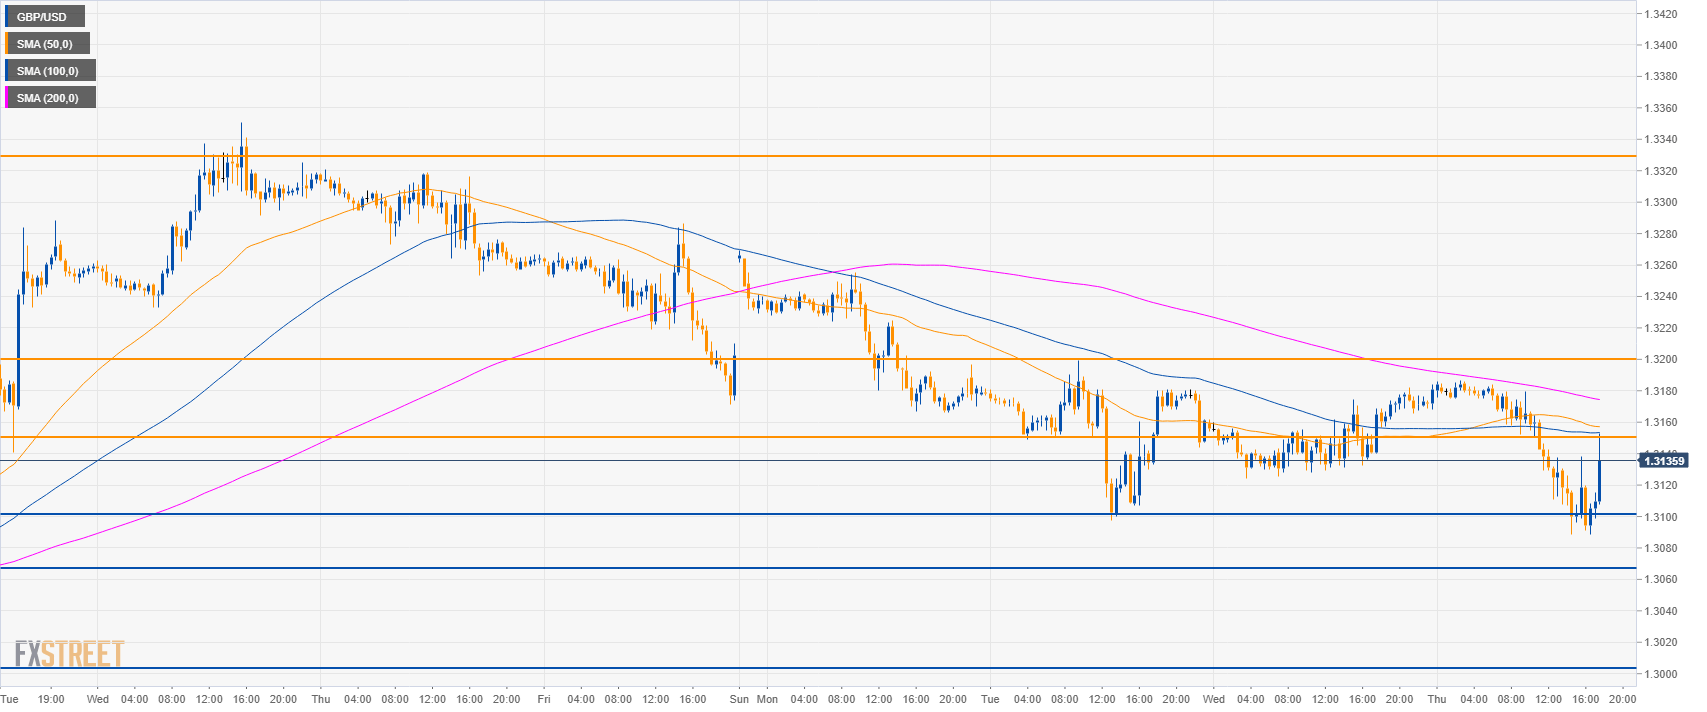
GBP/USD 30-minute chart
- GBP/USD is trading below the main SMAs suggesting bearish momentum.
- GBP/USD found some support at the 1.3100 figure as the market tested the 1.3150 resistance. A break above that level can lead to 1.3200 figure.
- Support is at 1.3100, 1.3065 and 1.3000 figure.
Additional key levels
GBP/USD
Overview:
Today Last Price: 1.3134
Today Daily change: -44 pips
Today Daily change %: -0.33%
Today Daily Open: 1.3178
Trends:
Daily SMA20: 1.3049
Daily SMA50: 1.2957
Daily SMA100: 1.2882
Daily SMA200: 1.2989
Levels:
Previous Daily High: 1.318
Previous Daily Low: 1.3124
Previous Weekly High: 1.3351
Previous Weekly Low: 1.3051
Previous Monthly High: 1.3351
Previous Monthly Low: 1.2773
Daily Fibonacci 38.2%: 1.3159
Daily Fibonacci 61.8%: 1.3146
Daily Pivot Point S1: 1.3141
Daily Pivot Point S2: 1.3104
Daily Pivot Point S3: 1.3084
Daily Pivot Point R1: 1.3197
Daily Pivot Point R2: 1.3217
Daily Pivot Point R3: 1.3254
