- NZD/USD clings to 0.6800 around early Monday.
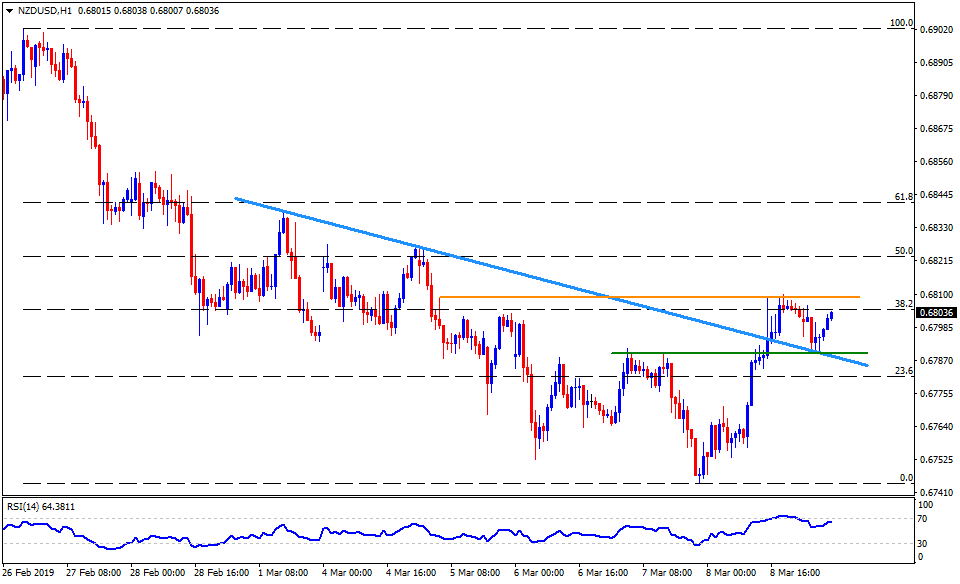
- During initial trading, the NZD/USD pair took a U-turn from 0.6790 support-confluence comprising a descending trend-line estd. from early-month and a horizontal-support including highs marked late last-week.
- As a result, chances of its upmoves to Friday highs near 0.6810 are high, a break of which could further escalate the recovery towards last-week high near 0.6830.
- Alternatively, downside break of 0.6790 can have 0.6760 and 0.6755 as follow-on rests.
- Also, 0.6745 and 0.6700 can please bears in a case of further declines beneath 0.6755.
NZD/USD hourly chart
Additional important levels:
Overview:
Today Last Price: 0.6804
Today Daily change: -2 pips
Today Daily change %: -0.03%
Today Daily Open: 0.6806
Trends:
Daily SMA20: 0.682
Daily SMA50: 0.6801
Daily SMA100: 0.6777
Daily SMA200: 0.6745
Levels:
Previous Daily High: 0.6811
Previous Daily Low: 0.6746
Previous Weekly High: 0.6832
Previous Weekly Low: 0.6744
Previous Monthly High: 0.6943
Previous Monthly Low: 0.6719
Daily Fibonacci 38.2%: 0.6786
Daily Fibonacci 61.8%: 0.6771
Daily Pivot Point S1: 0.6764
Daily Pivot Point S2: 0.6723
Daily Pivot Point S3: 0.6699
Daily Pivot Point R1: 0.6829
Daily Pivot Point R2: 0.6853
Daily Pivot Point R3: 0.6894
