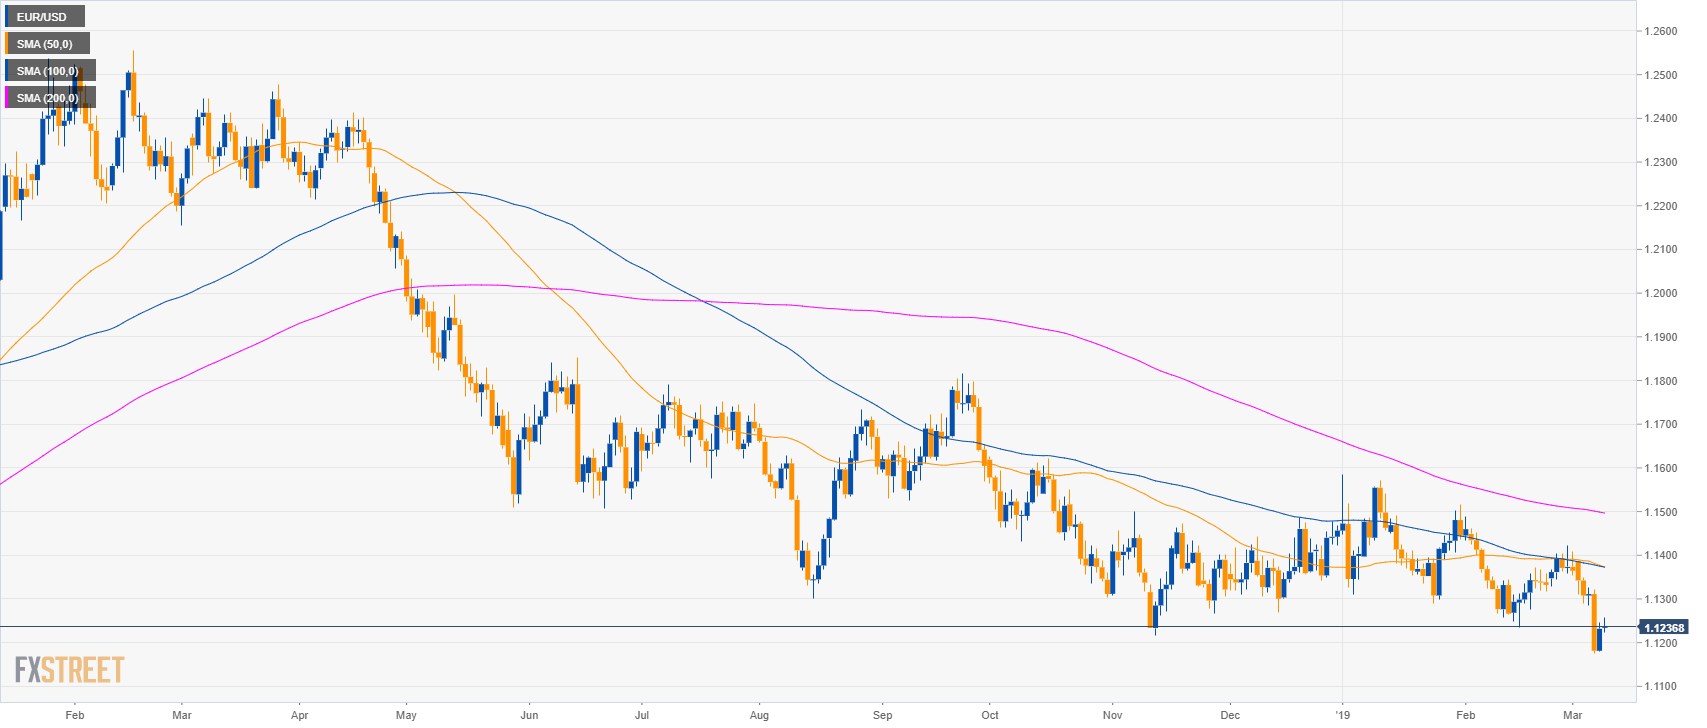
EUR/USD daily chart
- EUR/USD is trading in a bear trend below its main simple moving averages (SMAs).
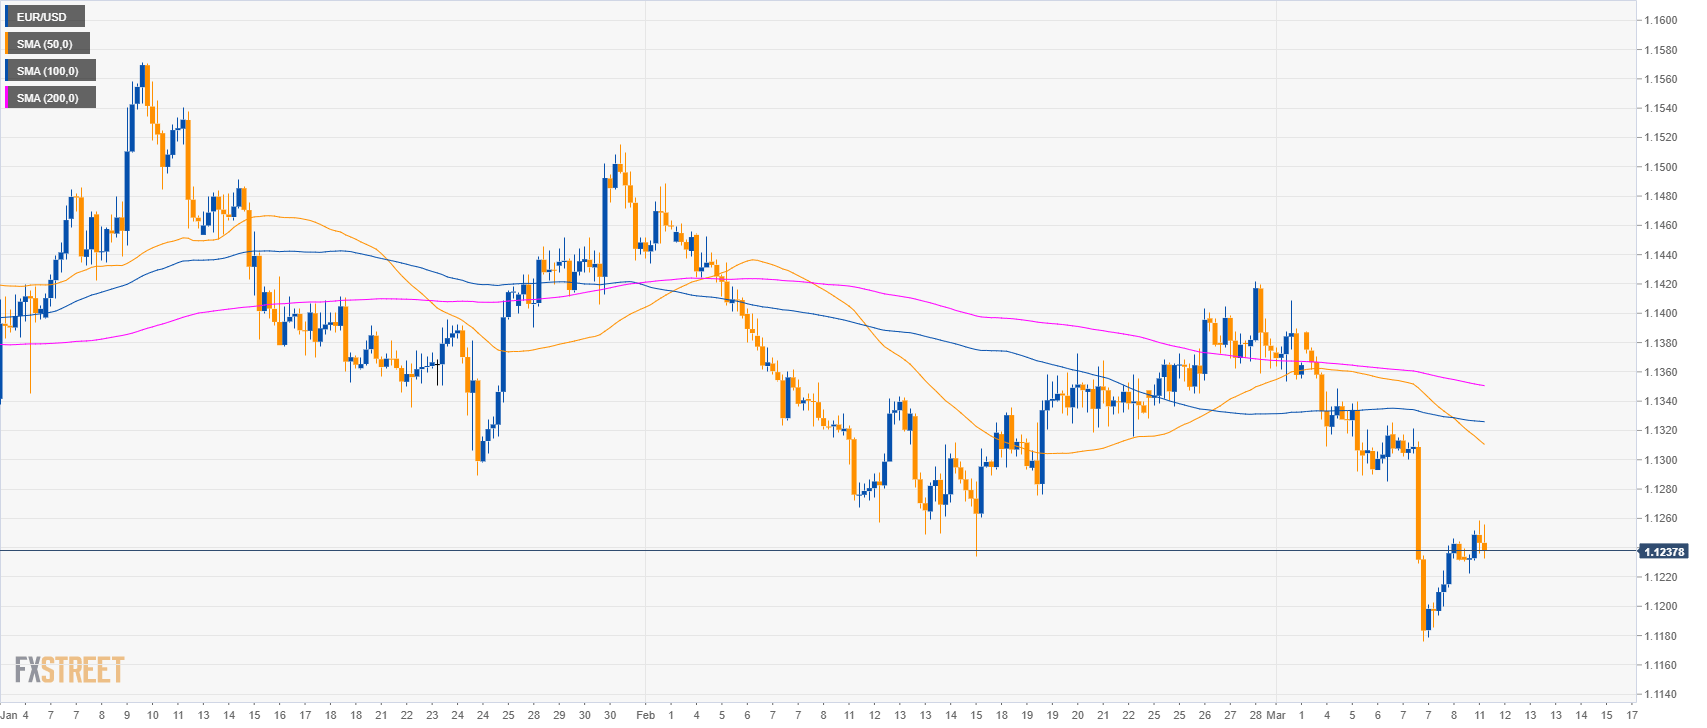
EUR/USD 4-hour chart
- EUR/USD is trading below its main SMAs suggesting bearish momentum.
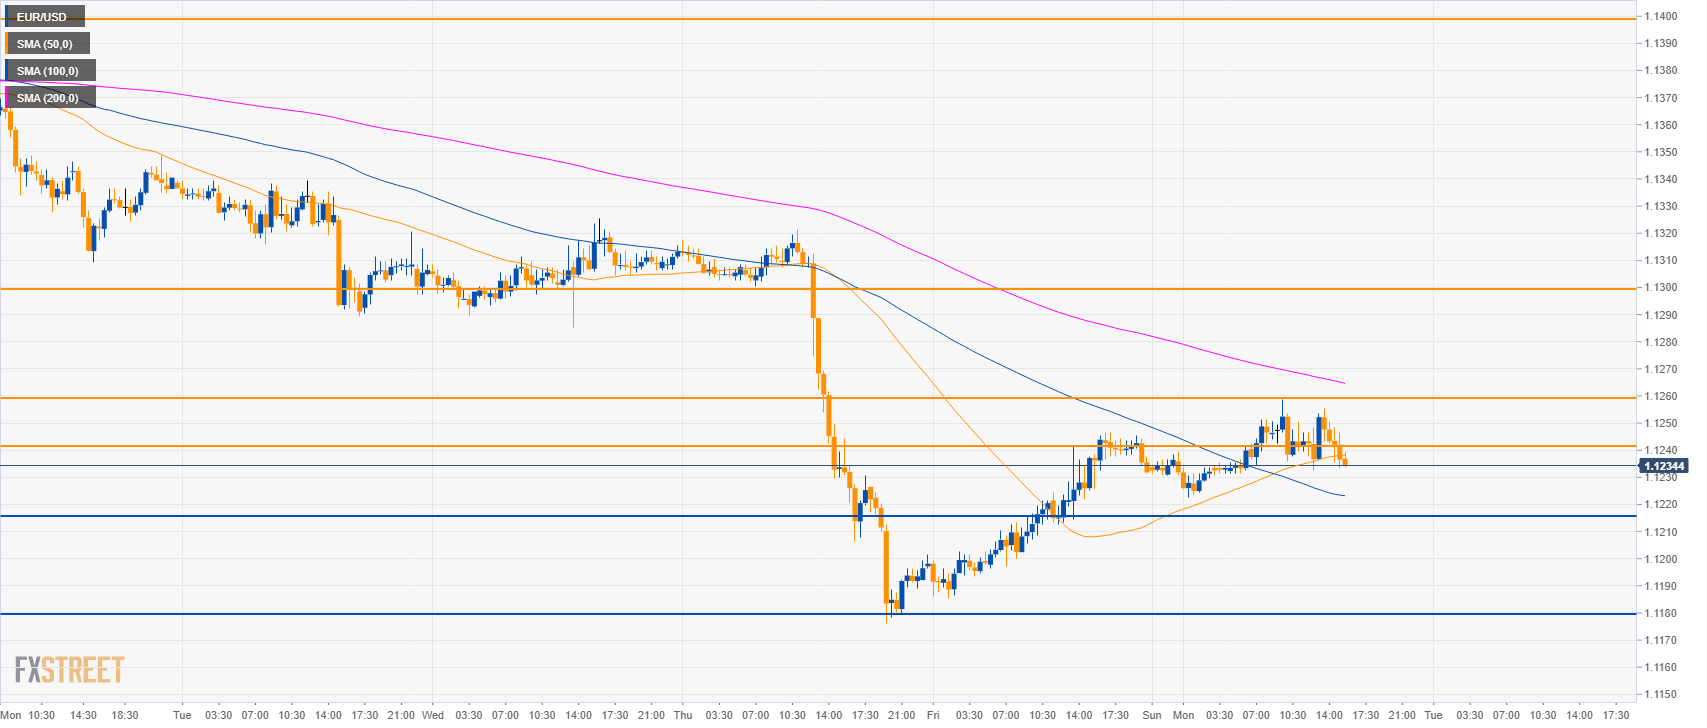
EUR/USD 30-minute chart
- EUR/USD is trading between the 50 and 100 SMA suggesting a consolidation of the recent bear move in the short-term.
- Support is seen at 1.1215 and 1.1180 level.
- Resistances to the upside are at 1.1260 and 1.1300 figure.
Additional key levels
EUR/USD
Overview:
Today Last Price: 1.1236
Today Daily change: 4 pips
Today Daily change %: 0.04%
Today Daily Open: 1.1232
Trends:
Daily SMA20: 1.1319
Daily SMA50: 1.1377
Daily SMA100: 1.1375
Daily SMA200: 1.1499
Levels:
Previous Daily High: 1.1246
Previous Daily Low: 1.118
Previous Weekly High: 1.1388
Previous Weekly Low: 1.1176
Previous Monthly High: 1.1489
Previous Monthly Low: 1.1234
Daily Fibonacci 38.2%: 1.1221
Daily Fibonacci 61.8%: 1.1205
Daily Pivot Point S1: 1.1192
Daily Pivot Point S2: 1.1153
Daily Pivot Point S3: 1.1126
Daily Pivot Point R1: 1.1259
Daily Pivot Point R2: 1.1286
Daily Pivot Point R3: 1.1325
