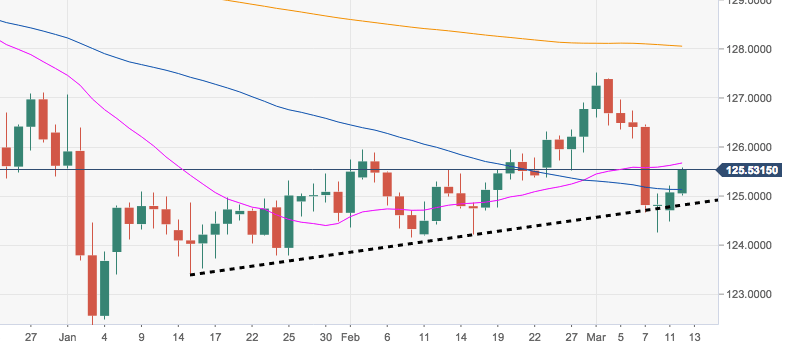
- The cross is prolonging the correction higher since last week’s multi-day lows in the 124.25/30 band.
- EUR/JPY now re-targets the 126.00 neighbourhood, where coincide early February peaks and the 10-day SMA.
- Looking at the broader picture, the upside in the cross appears propped up by the short-term support line at 124.80.
EUR/JPY daily chart
EUR/JPY
Overview:
Today Last Price: 125.53
Today Daily change: 61 pips
Today Daily change %: 0.36%
Today Daily Open: 125.08
Trends:
Daily SMA20: 125.68
Daily SMA50: 125.03
Daily SMA100: 126.61
Daily SMA200: 128.07
Levels:
Previous Daily High: 125.21
Previous Daily Low: 124.48
Previous Weekly High: 127.4
Previous Weekly Low: 124.26
Previous Monthly High: 126.92
Previous Monthly Low: 124.16
Daily Fibonacci 38.2%: 124.93
Daily Fibonacci 61.8%: 124.76
Daily Pivot Point S1: 124.63
Daily Pivot Point S2: 124.18
Daily Pivot Point S3: 123.9
Daily Pivot Point R1: 125.36
Daily Pivot Point R2: 125.66
Daily Pivot Point R3: 126.1
