“¢ The pair remained under some selling pressure for the second consecutive session and dropped to near one-week lows in the last hour, albeit found some support near the 1.0050 area.
“¢ The mentioned support comprises of 200-hour SMA and also nears 38.2% Fibo. level of the 0.9926-1.0125 recent upsurge and should now act as a key pivotal point for short-term traders.
“¢ Technical indicators on hourly charts have been gaining negative traction and have also started losing positive momentum on the daily chart, suggesting further near-term downside.
“¢ A sustained break below the said confluence support will reinforce the bearish bias and turn the pair vulnerable to break below 50% Fibo. support and aim towards challenging the parity mark.
USD/CHF 1-hourly chart
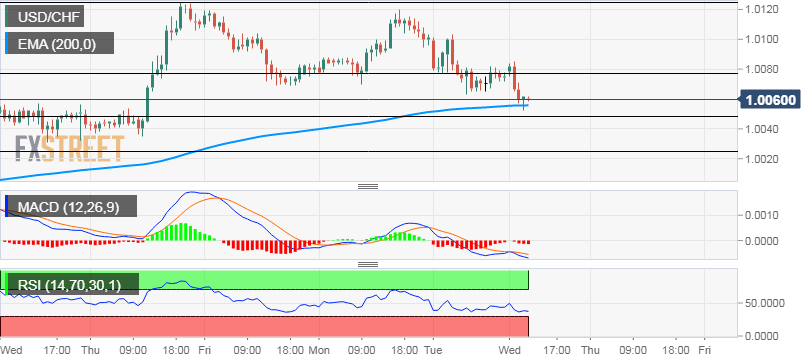
USD/CHF
Overview:
Today Last Price: 1.0062
Today Daily change: -16 pips
Today Daily change %: -0.16%
Today Daily Open: 1.0078
Trends:
Daily SMA20: 1.0036
Daily SMA50: 0.997
Daily SMA100: 0.9969
Daily SMA200: 0.9918
Levels:
Previous Daily High: 1.0112
Previous Daily Low: 1.0063
Previous Weekly High: 1.0125
Previous Weekly Low: 0.9977
Previous Monthly High: 1.01
Previous Monthly Low: 0.9921
Daily Fibonacci 38.2%: 1.0082
Daily Fibonacci 61.8%: 1.0093
Daily Pivot Point S1: 1.0057
Daily Pivot Point S2: 1.0035
Daily Pivot Point S3: 1.0008
Daily Pivot Point R1: 1.0106
Daily Pivot Point R2: 1.0133
Daily Pivot Point R3: 1.0155
