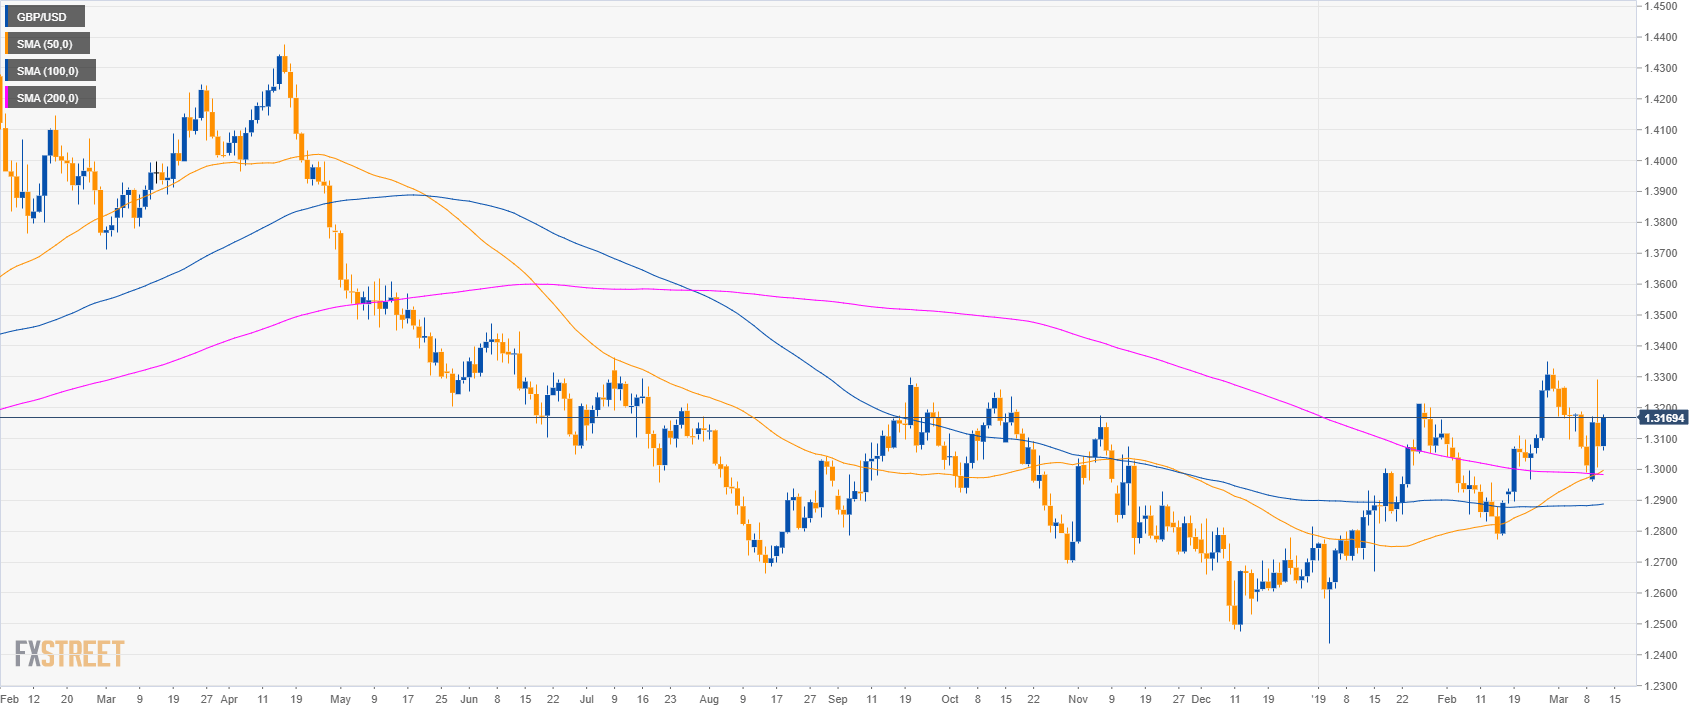
GBP/USD daily chart
- GBP/USD is trading in a bull trend above its main simple moving averages.
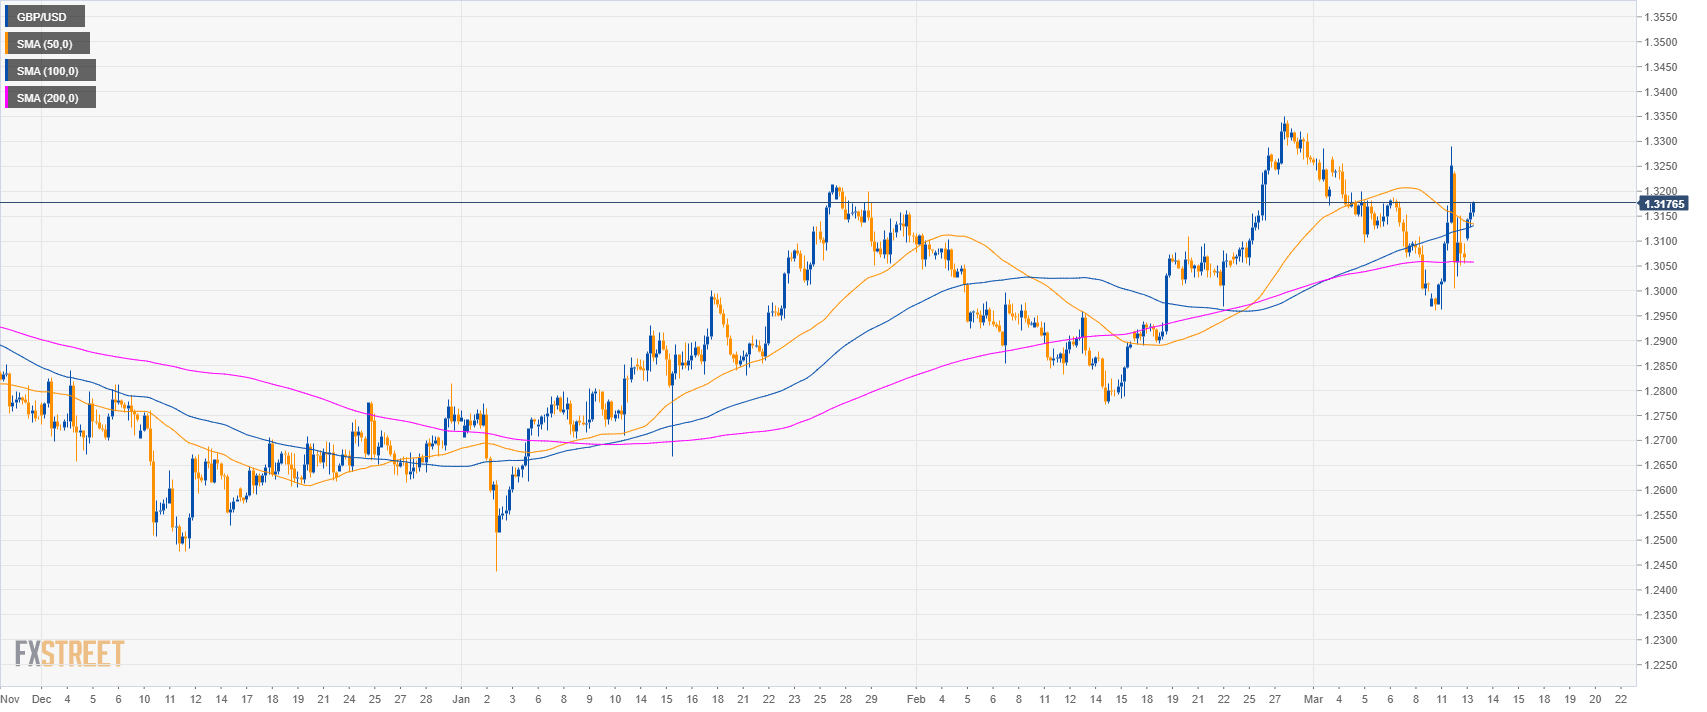
GBP/USD 4-hour chart
- GBP/USD is trading above its main SMAs suggesting bullish momentum in the medium-term.
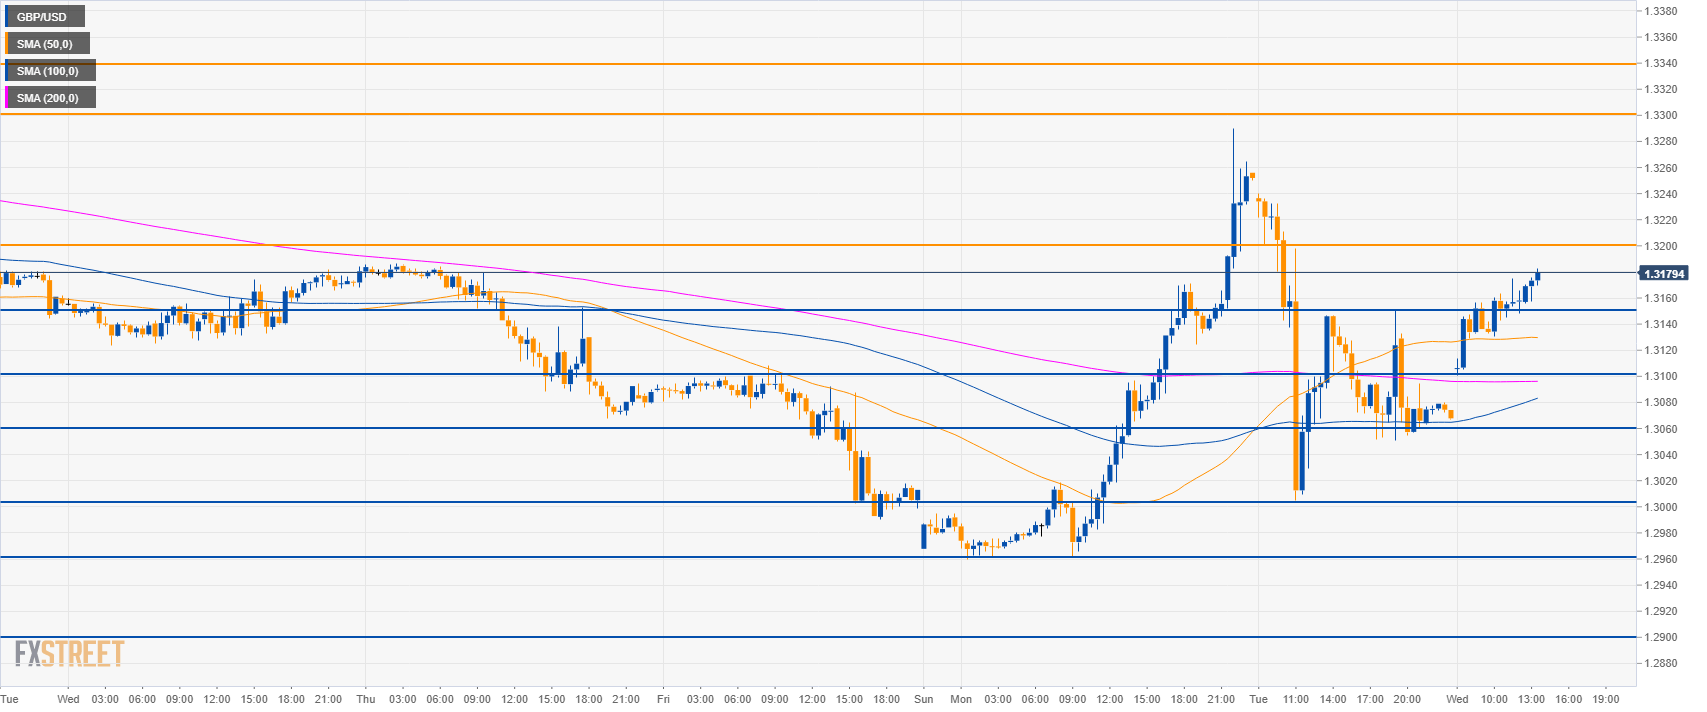
GBP/USD 30-minute chart
- GBP/USD is trading above its main SMAs suggesting bullish momentum in the short-term.
- A break above 1.3200 key resistance can lead to 1.3300 and 1.3340 resistances.
- To the downside, immediate supports are seen near 1.3150, 1.3100 figure and 1.3060 level.
Additional key levels
GBP/USD
Overview:
Today Last Price: 1.3176
Today Daily change: 101 pips
Today Daily change %: 0.77%
Today Daily Open: 1.3075
Trends:
Daily SMA20: 1.3082
Daily SMA50: 1.2986
Daily SMA100: 1.2885
Daily SMA200: 1.2984
Levels:
Previous Daily High: 1.329
Previous Daily Low: 1.3005
Previous Weekly High: 1.3269
Previous Weekly Low: 1.299
Previous Monthly High: 1.3351
Previous Monthly Low: 1.2773
Daily Fibonacci 38.2%: 1.3114
Daily Fibonacci 61.8%: 1.3181
Daily Pivot Point S1: 1.2957
Daily Pivot Point S2: 1.2838
Daily Pivot Point S3: 1.2671
Daily Pivot Point R1: 1.3242
Daily Pivot Point R2: 1.3409
Daily Pivot Point R3: 1.3527
