“¢ The pair struggled to capitalize on the recent positive momentum and faced rejection near the 0.7100 round figure mark in wake of sluggish Chinese industrial production data.
“¢ The mentioned handle also nears 50% Fibonacci retracement level of the 0.7199-0.7002 recent downfall and should continue to act as a key hurdle capping any attempted up-moves.
“¢ Meanwhile, the fact that the pair seems to have found acceptance below important intraday moving averages – 50, 100 & 200-hour SMAs, clearly points to increasing selling pressure.
“¢ Bearish technical indicators on hourly/daily charts add credence to the bearish set-up, though traders might await a sustained break through 23.6% Fibonacci retracement level support.
AUD/USD 1-hourly chart
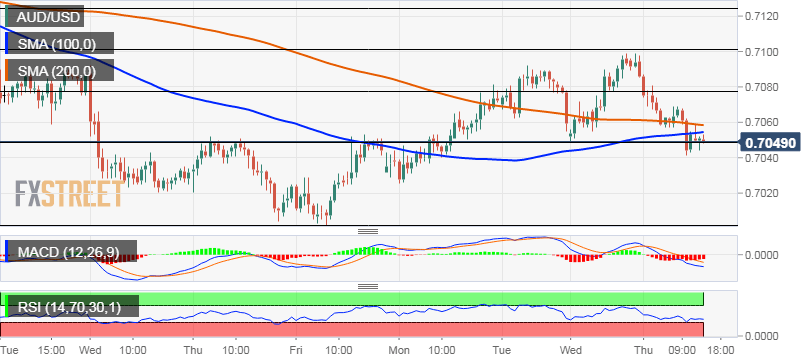
AUD/USD
Overview:
Today Last Price: 0.7051
Today Daily change: -43 pips
Today Daily change %: -0.61%
Today Daily Open: 0.7094
Trends:
Daily SMA20: 0.7105
Daily SMA50: 0.7136
Daily SMA100: 0.7161
Daily SMA200: 0.7232
Levels:
Previous Daily High: 0.7099
Previous Daily Low: 0.7049
Previous Weekly High: 0.7118
Previous Weekly Low: 0.7002
Previous Monthly High: 0.7285
Previous Monthly Low: 0.7053
Daily Fibonacci 38.2%: 0.708
Daily Fibonacci 61.8%: 0.7068
Daily Pivot Point S1: 0.7062
Daily Pivot Point S2: 0.7031
Daily Pivot Point S3: 0.7012
Daily Pivot Point R1: 0.7112
Daily Pivot Point R2: 0.7131
Daily Pivot Point R3: 0.7162
