- The USD/MXN pair is rising today after falling during four days in-a-row on the back of a weaker US dollar. So far today, gains are limited and price remains above a key support level, supporting the bullish tone.
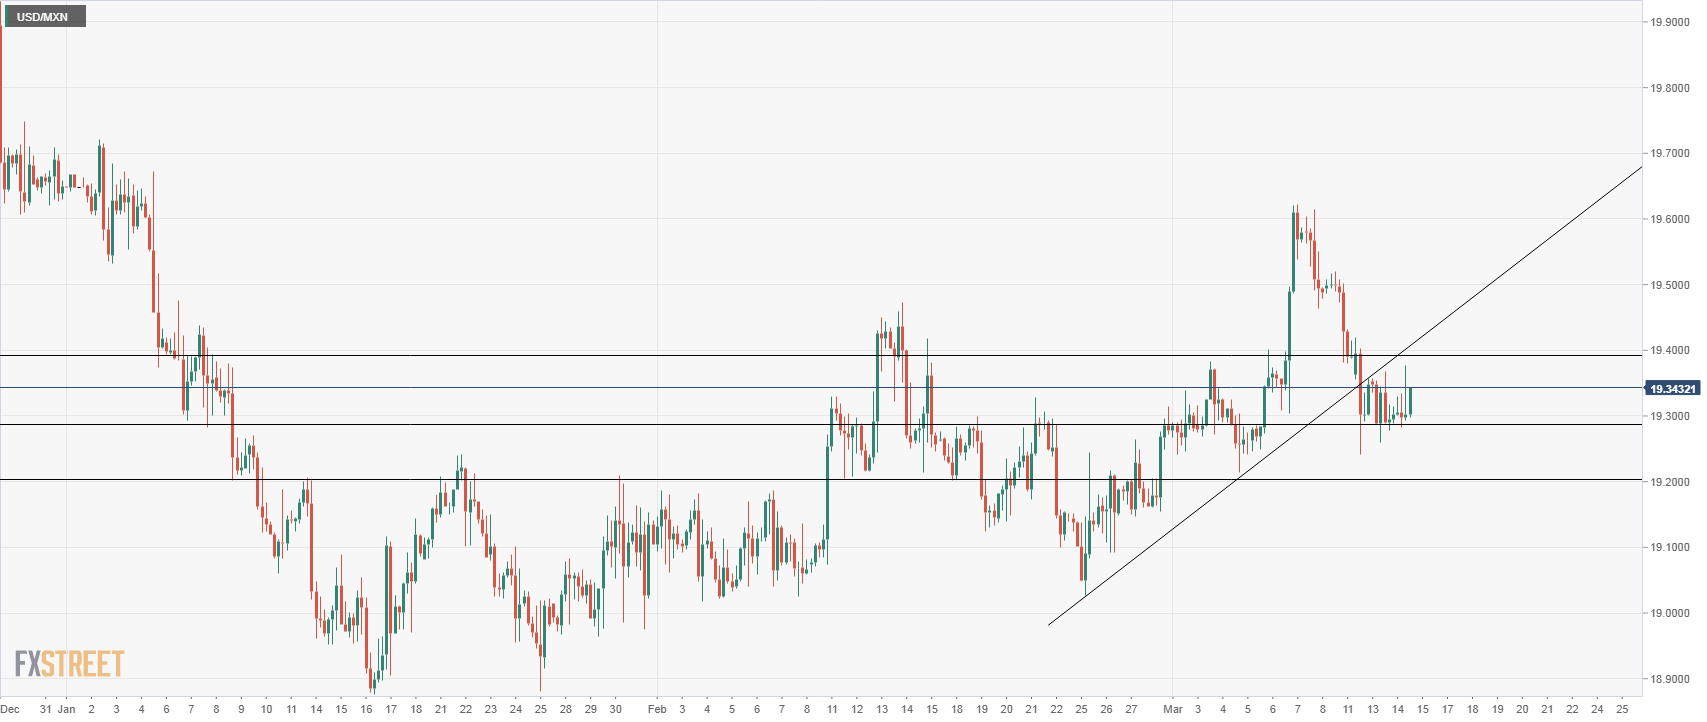
- To the downside, the area between 19.25 and 19.30 is a crucial support: 20-day moving average, uptrend line, and horizontal level. A daily close significantly below would clear the way to more losses and potentially to a test of 19.00 and the medium-term uptrend seen at 18.97.
- If the pair holds on top of 19.30, the bullish bias will remain in place. The US dollar needs to recover on top of 19.40 to gain momentum. The key resistance levels are seen at 19.45 and 19.60. Above 19.60 the next target is seen at 19.85.
USD/MXN Daily chart
-636881838623186305.png)
USD/MXN 4 hour chart
Overview:
Today Last Price: 19.342
Today Daily change %: 0.30%
Today Daily Open: 19.2842
Trends:
Daily SMA20: 19.2809
Daily SMA50: 19.2013
Daily SMA100: 19.658
Daily SMA200: 19.4274
Levels:
Previous Daily High: 19.3673
Previous Daily Low: 19.2604
Previous Weekly High: 19.6225
Previous Weekly Low: 19.214
Previous Monthly High: 19.4726
Previous Monthly Low: 19.0168
Daily Fibonacci 38.2%: 19.3012
Daily Fibonacci 61.8%: 19.3265
Daily Pivot Point S1: 19.2406
Daily Pivot Point S2: 19.197
Daily Pivot Point S3: 19.1337
Daily Pivot Point R1: 19.3475
Daily Pivot Point R2: 19.4109
Daily Pivot Point R3: 19.4545
