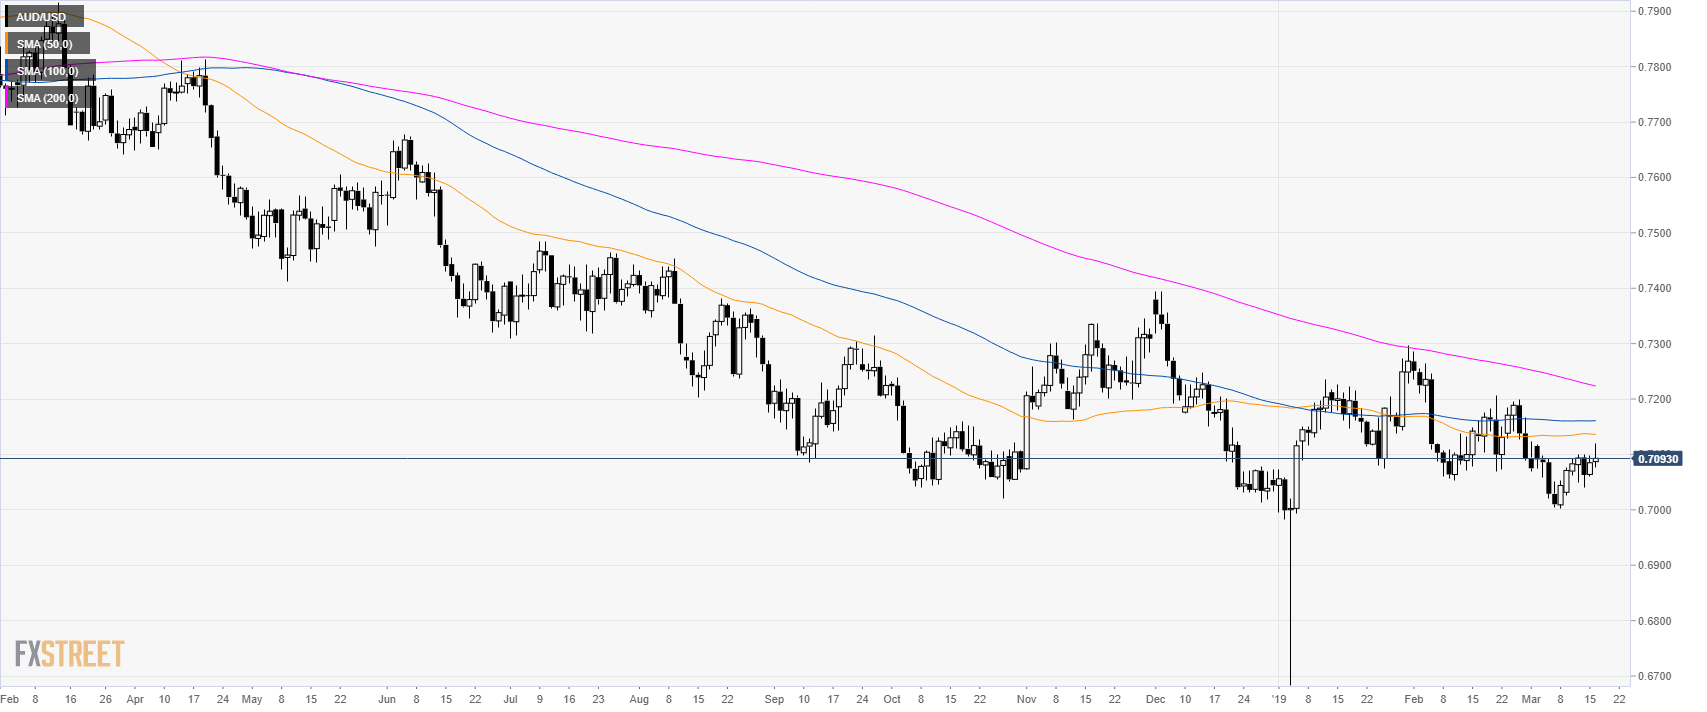
AUD/USD daily chart
- AUD/USD is trading in a bear trend below its main simple moving averages (SMAs).
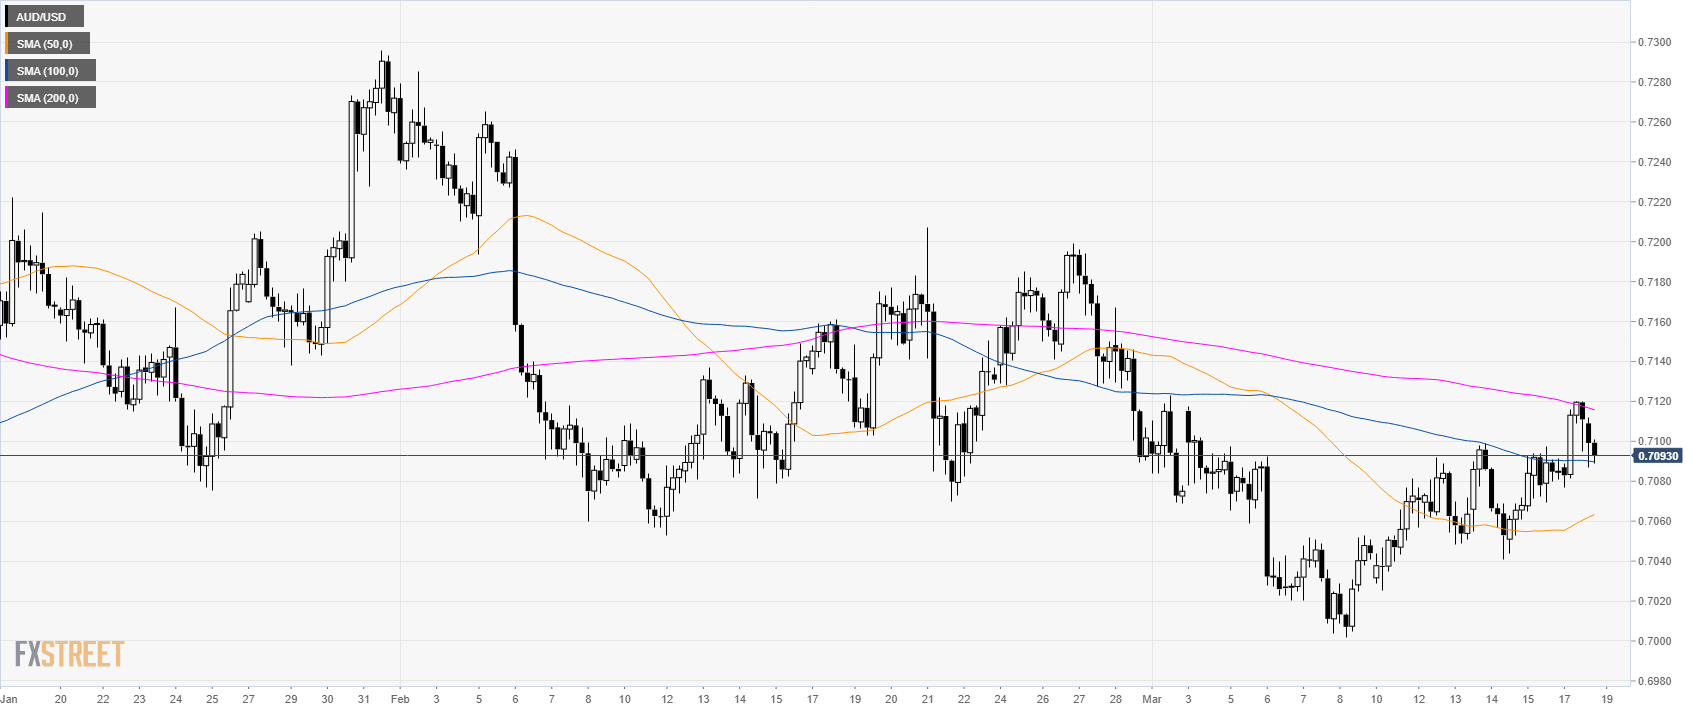
AUD/USD 4-hour chart
- AUD/USD is trading between the 50 and 100 SMAs suggesting a consolidation in the medium-term.
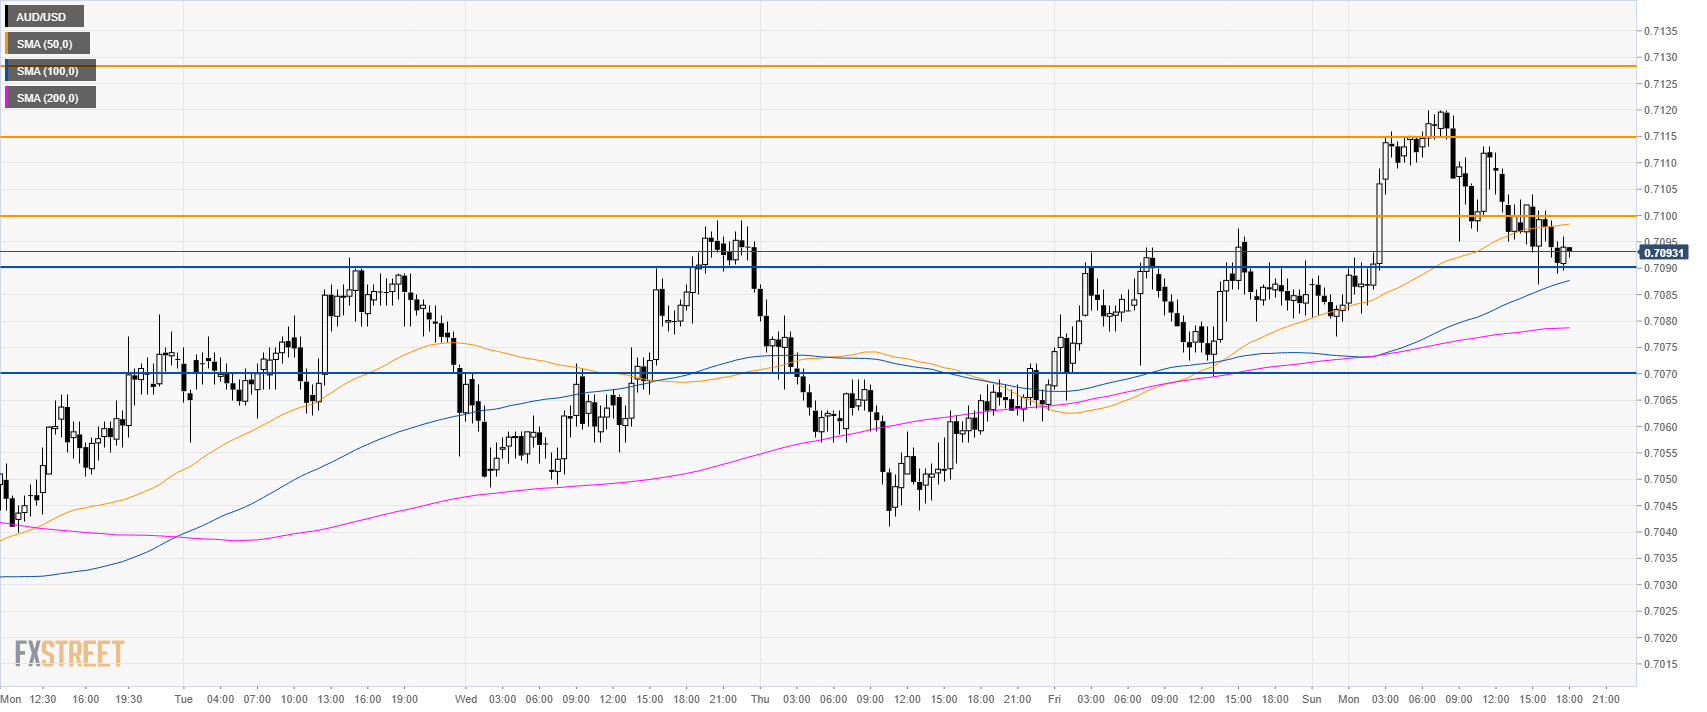
AUD/USD 30-minute chart
- AUD/USD is trading above its 100 and 200 SMAs suggesting bullish momentum.
- A break above 0.7100 can lead to a move up to 0.7115 and 0.7130 resistances.
- Support to the downside is at 0.7090 and 0.7070 key level.
Additional key levels
AUD/USD
Overview:
Today Last Price: 0.7094
Today Daily change: 9 pips
Today Daily change %: 0.13%
Today Daily Open: 0.7085
Trends:
Daily SMA20: 0.7101
Daily SMA50: 0.7137
Daily SMA100: 0.7161
Daily SMA200: 0.7226
Levels:
Previous Daily High: 0.7098
Previous Daily Low: 0.7061
Previous Weekly High: 0.7099
Previous Weekly Low: 0.7026
Previous Monthly High: 0.7285
Previous Monthly Low: 0.7053
Daily Fibonacci 38.2%: 0.7084
Daily Fibonacci 61.8%: 0.7075
Daily Pivot Point S1: 0.7065
Daily Pivot Point S2: 0.7045
Daily Pivot Point S3: 0.7028
Daily Pivot Point R1: 0.7101
Daily Pivot Point R2: 0.7118
Daily Pivot Point R3: 0.7138
