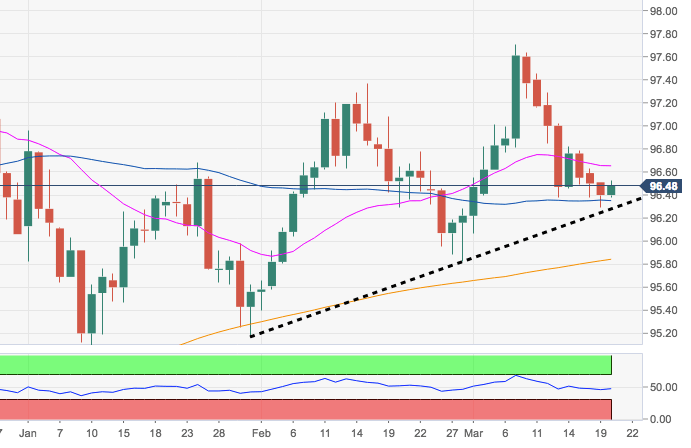
- Despite the ongoing rebound, the index stays depressed this week, meeting contention in the 96.30 for the time being, where emerges the short-term support line.
- A breach of this support line could open the door for a deeper retracement to the 95.80/85 band, where coincide the 200-day SMA and late February lows.
- On the other hand, a reversion of the current leg lower remains on the cards as long as this support line holds the downside.
DXY daily chart
Dollar Index Spot
Overview:
Today Last Price: 96.47
Today Daily change: 15 pips
Today Daily change %: 0.07%
Today Daily Open: 96.4
Trends:
Daily SMA20: 96.66
Daily SMA50: 96.38
Daily SMA100: 96.57
Daily SMA200: 95.83
Levels:
Previous Daily High: 96.51
Previous Daily Low: 96.29
Previous Weekly High: 97.45
Previous Weekly Low: 96.38
Previous Monthly High: 97.37
Previous Monthly Low: 95.4
Daily Fibonacci 38.2%: 96.37
Daily Fibonacci 61.8%: 96.43
Daily Pivot Point S1: 96.29
Daily Pivot Point S2: 96.18
Daily Pivot Point S3: 96.07
Daily Pivot Point R1: 96.51
Daily Pivot Point R2: 96.62
Daily Pivot Point R3: 96.73
