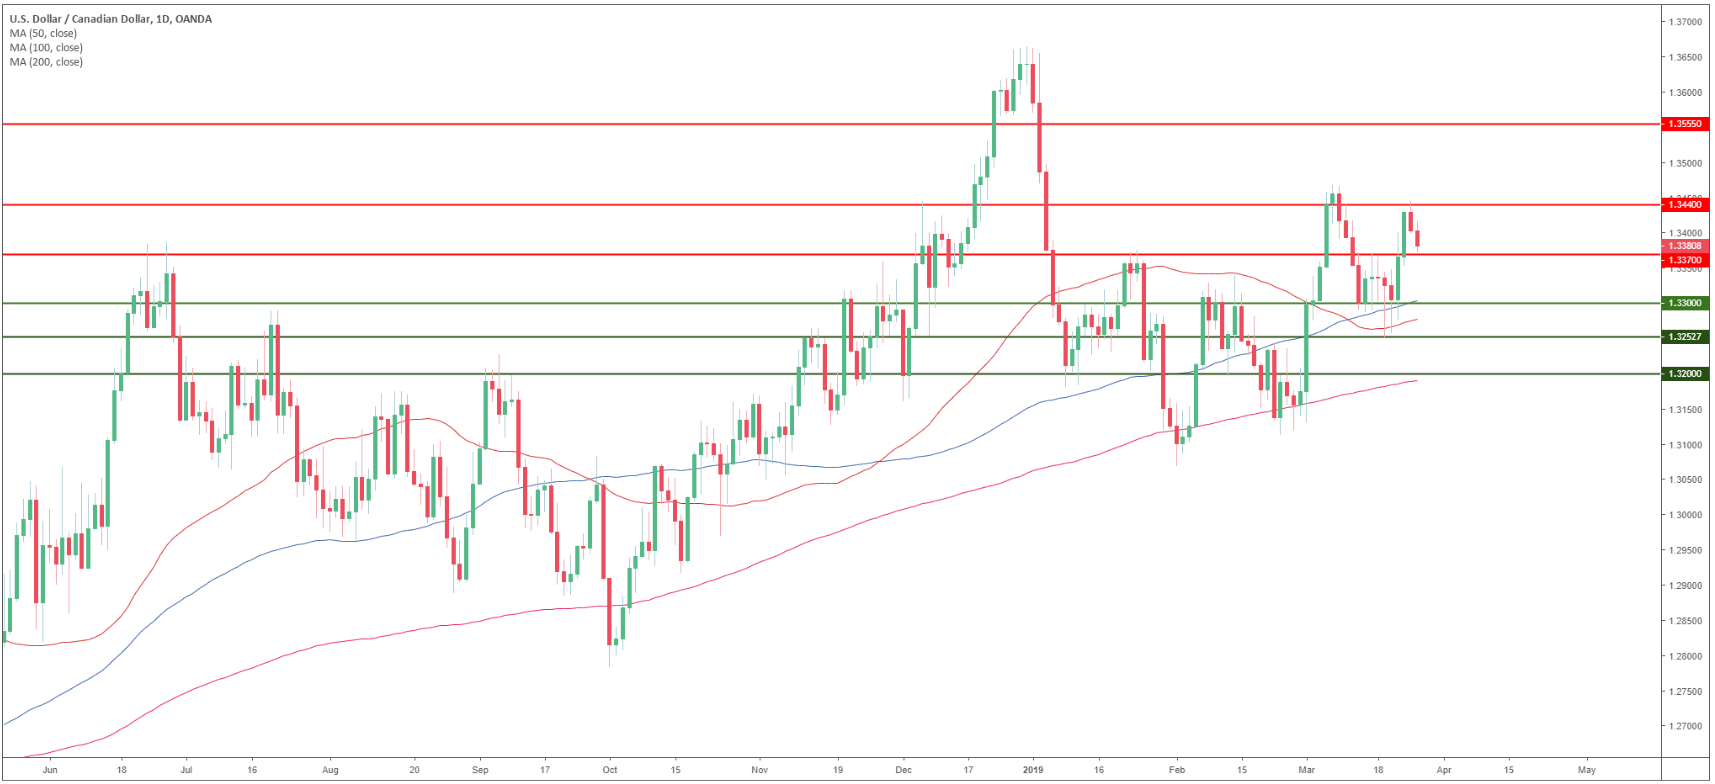
USD/CAD daily chart
- USD/CAD is trading in a bull trend above the 200-day simple moving averages (SMA).
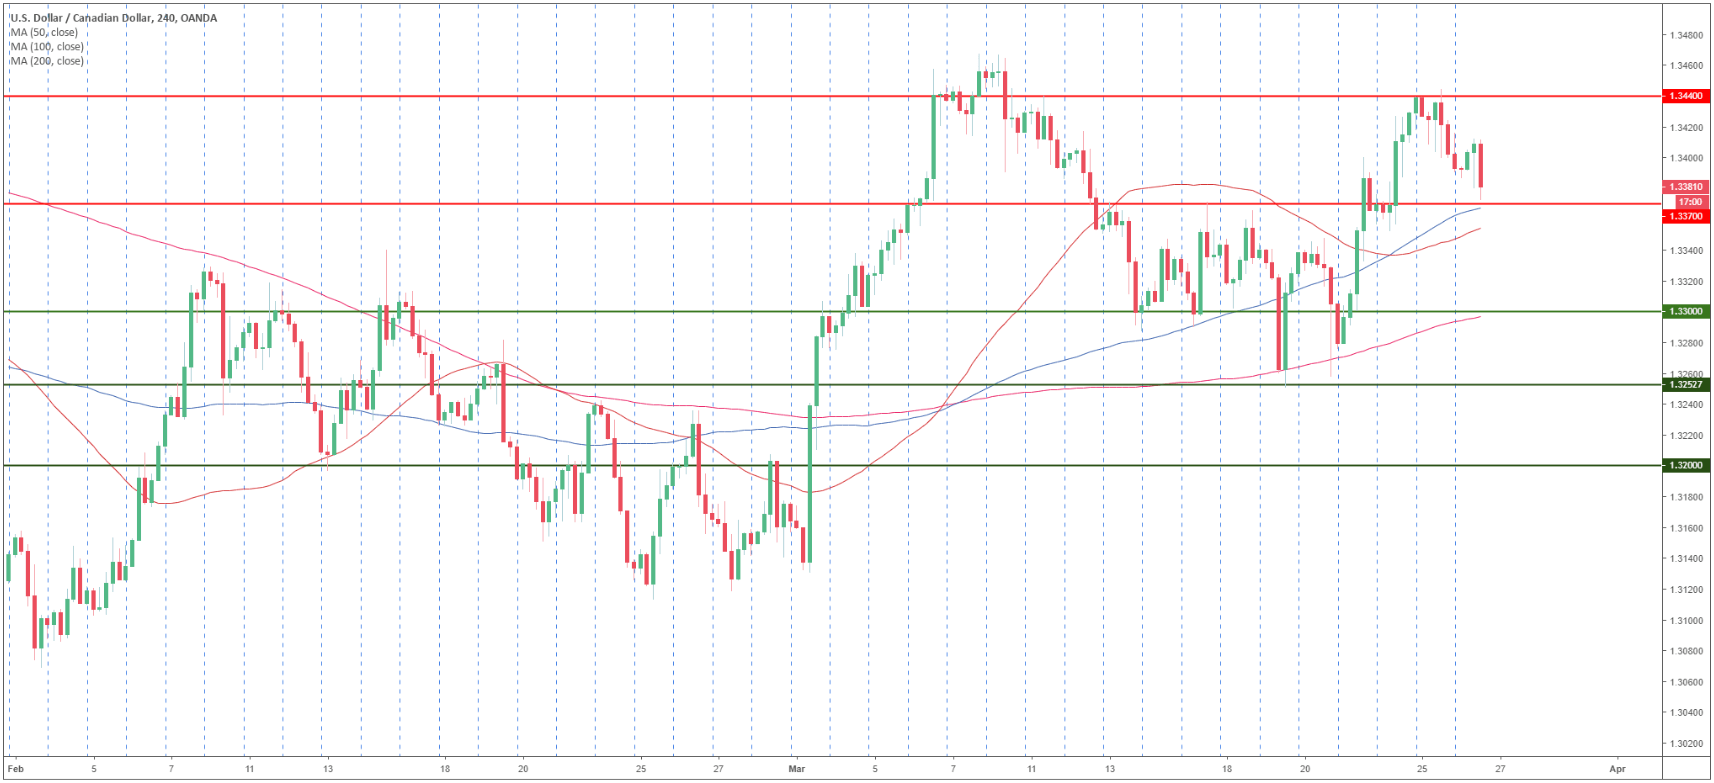
USD/CAD 4-hour chart
- USD/CAD is trading above its main SMAs suggesting bullish momentum in the medium-term.
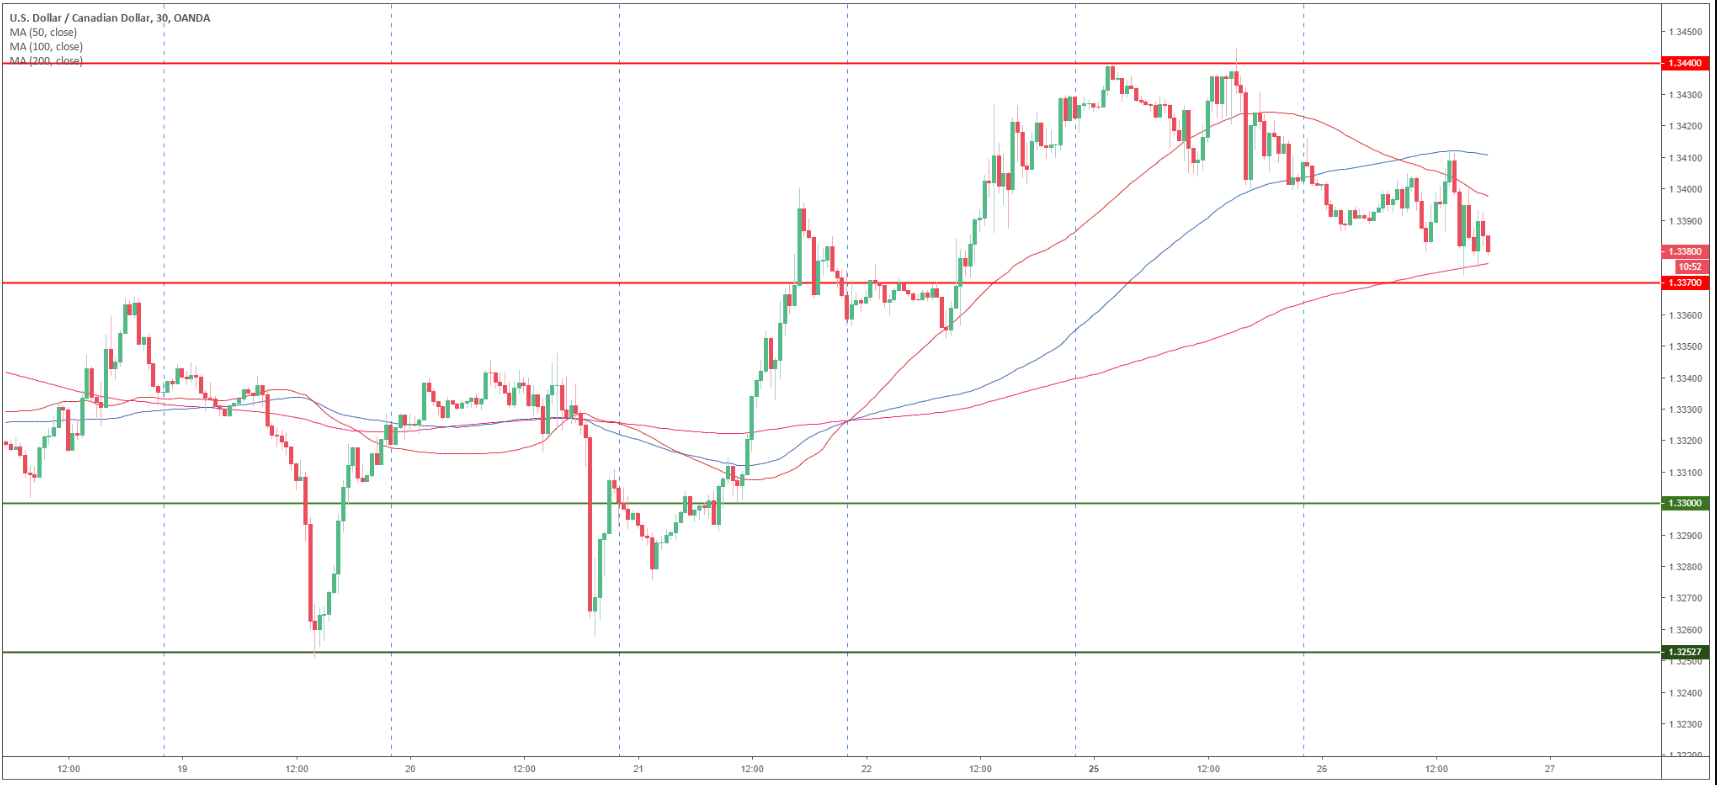
USD/CAD 30-minute chart
- USD/CAD is trading below its 50 and 100 SMAs suggesting a weak bull trend in the short-term.
- A break below 1.3370 key support can lead to 1.3300 figure.
- Resistances are at 1.3340 and 1.3400 the figure.
Additional key levels
