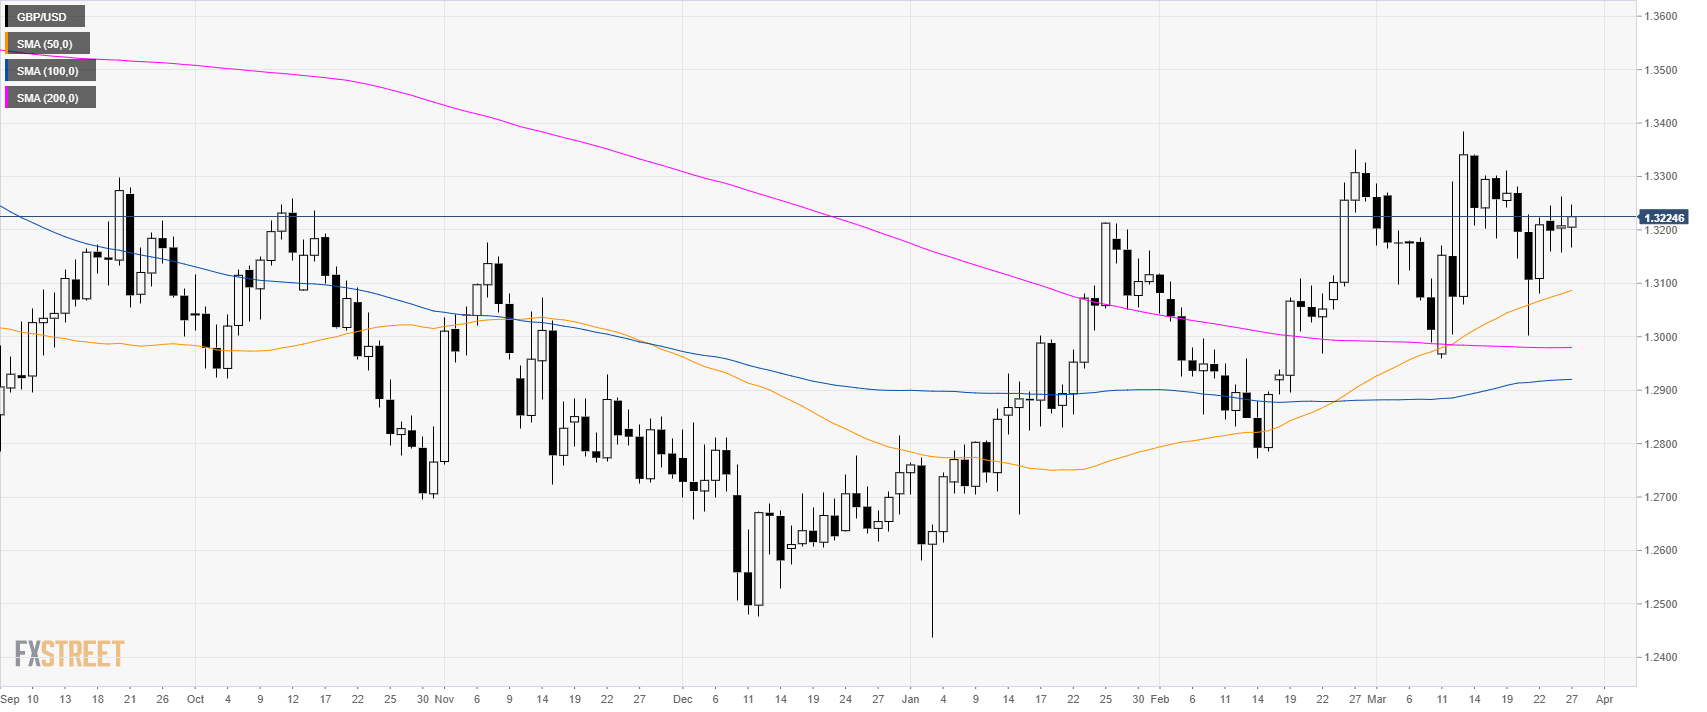
GBP/USD daily chart
- GBP/USD is trading in a bull trend above its main simple moving averages (SMAs).
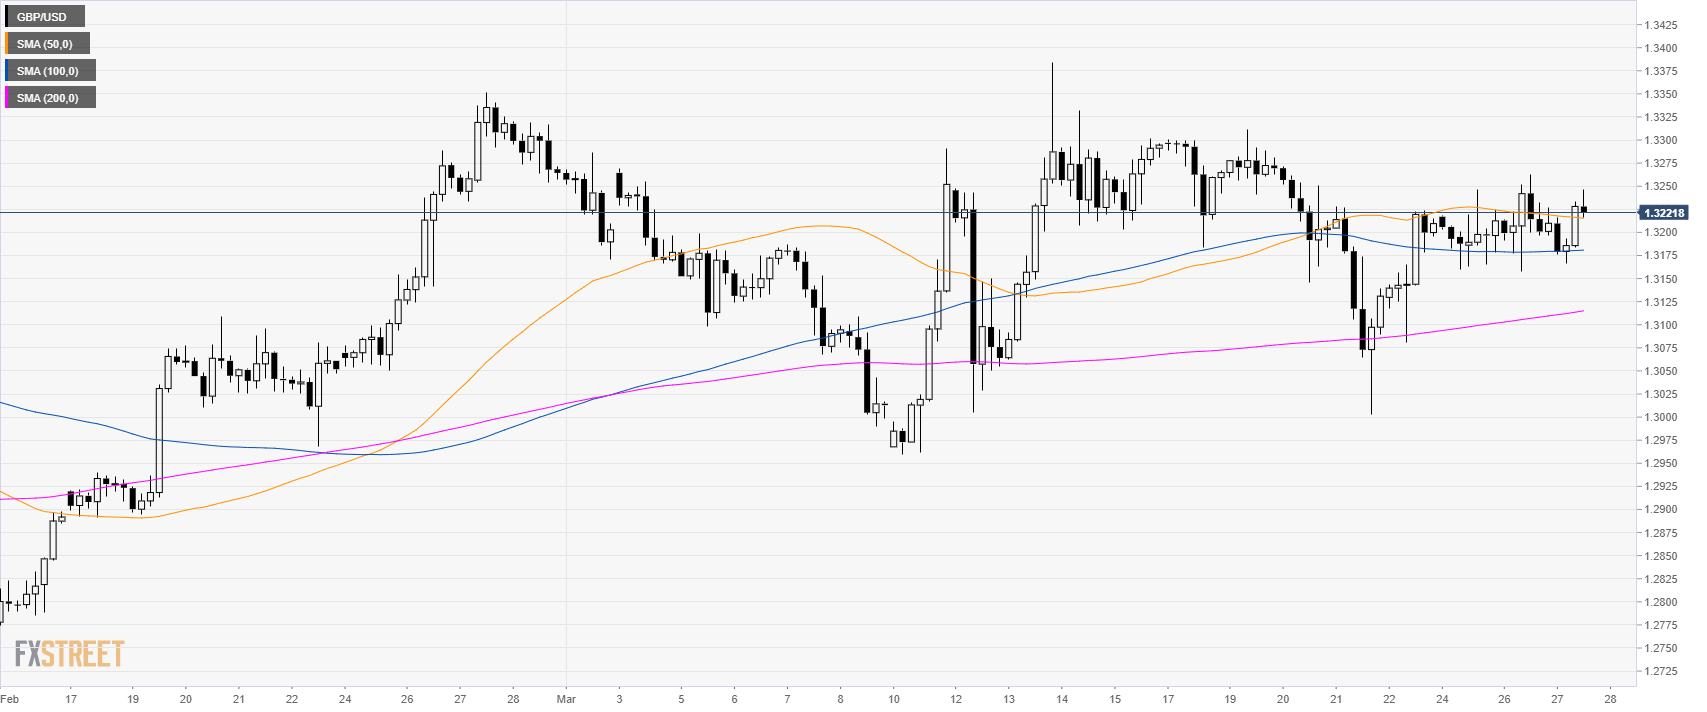
GBP/USD 4-hour chart
- GBP/USD is trading above its main SMAs suggesting a bullish momentum in the medium-term.
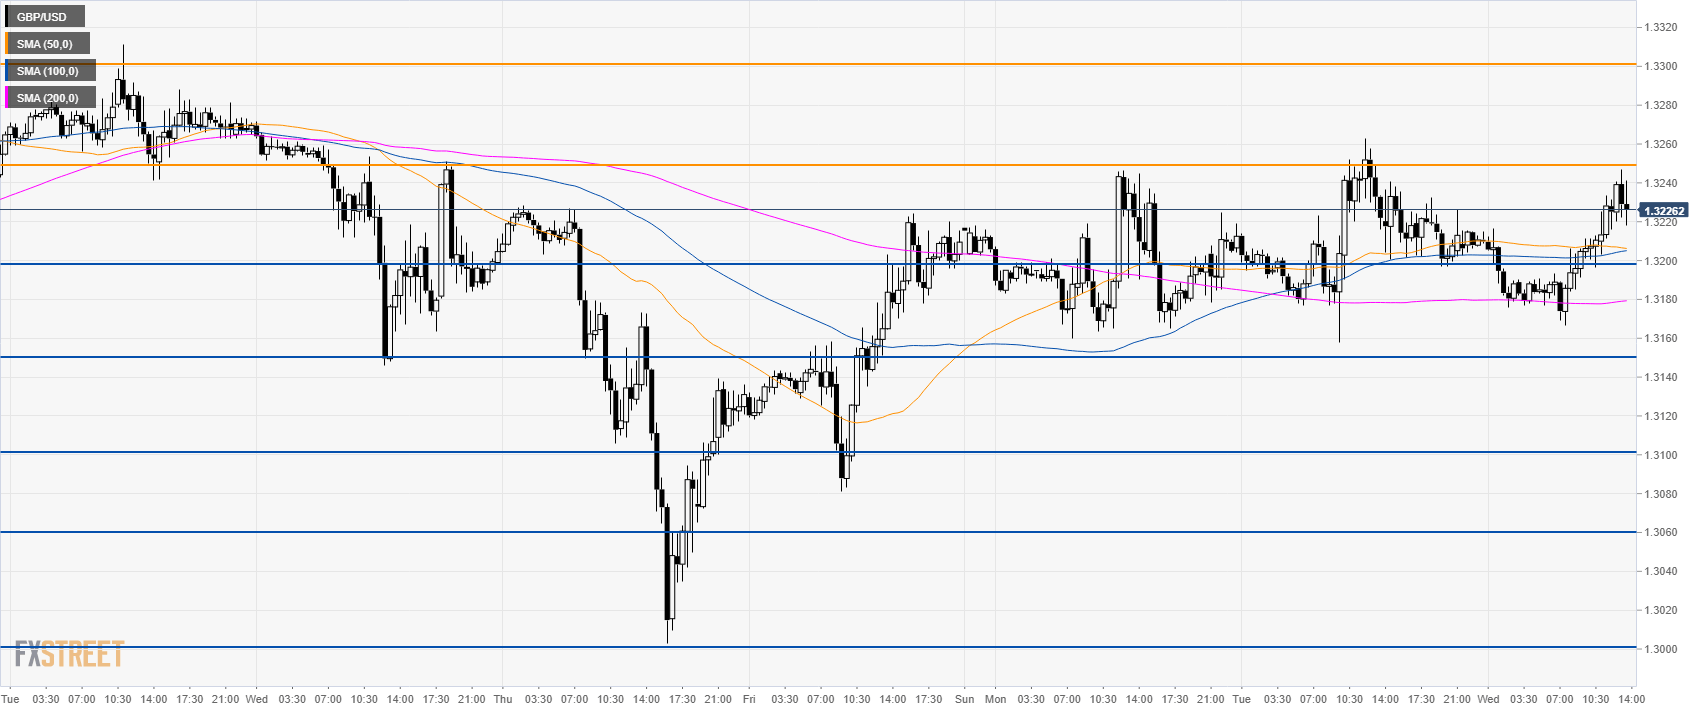
GBP/USD 30-minute chart
- GBP/USD is trading in a 100-pip range between the 1.3150 and 1.3250 level.
- Bears need a break below 1.3150 to reach 1.3100 and 1.3060 to the downside.
- Resistances are seen at 1.3250 and 1.3300 figure.
Additional key levels
