- As can be seen, GBP/USD has hit the 1.3050 Fibo target mentioned in yesterday’s GBP/USD Technical Analysis: Break of 38.2% Fibo support opens risk to test 1.31 the figure.
- The move was purely fundamental although the 78.6% Fibo psychological level has put a technical spin on the move.
- This is a level that meets the daily trend line support which guards the 200-D SMA as bears look for a test below 1.30 the figure.
- Below the 200 day ma lies 1.2960 swing low, then the double Fibo retracement at 1.2900/1.2895 and then the recent low at 1.2772.

GBP/USD Hourly chart demonstrates yesterday’s analysis and subsequent price action to 78.6% target
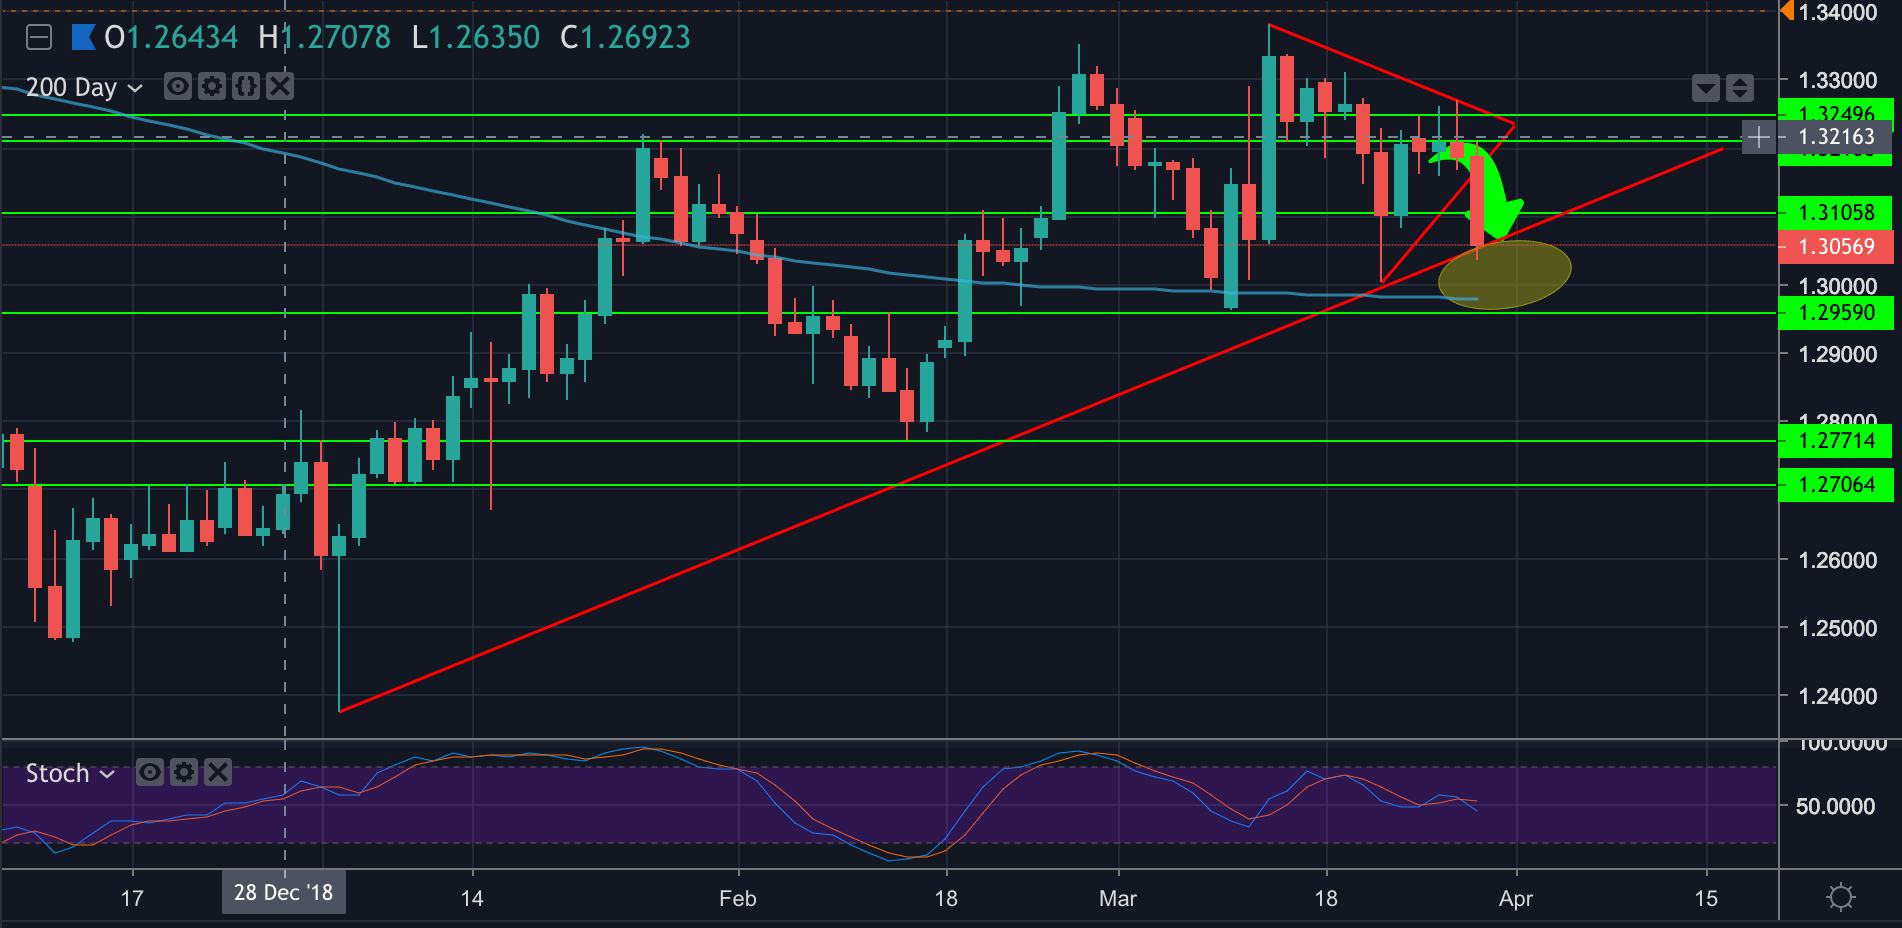
GBP/USD daily chart illustrates 200-D SMA target below trend line support and subsequent support levels
