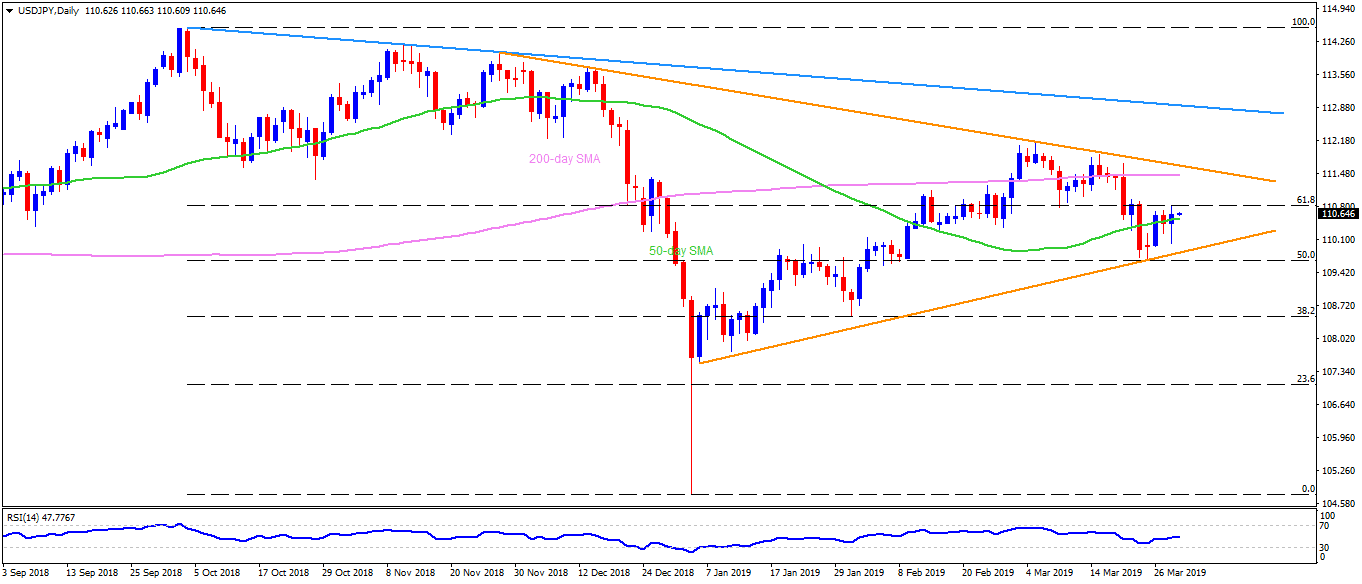
USD/JPY daily chart
- USD/JPY trades near 110.70 ahead of Tokyo open on Friday.
- The quote recently surpassed 50-day simple moving average (SMA) and may soon head towards 61.8% Fibonacci retracement of its October 2018 to January 2019 downturn at 110.85.
- During the pair’s advances past-110.85, 200-day SMA level of 111.45 and a four-month-old descending resistance line near 111.70 could challenge buyers.
- Also, pair’s ability to cross 111.70 enables it to aim for 112.20 and a downward sloping trend-line stretched since October around 113.00.
- On the downside, break under 50-day SMA level of 110.50 can avail 110.00 and a short-term ascending support-line, at 109.80 now.
- Though 50% Fibonacci retracement level of 109.70 could further validate the quote’s drop to 109.10, 108.50 and 108.00 past-109.80.
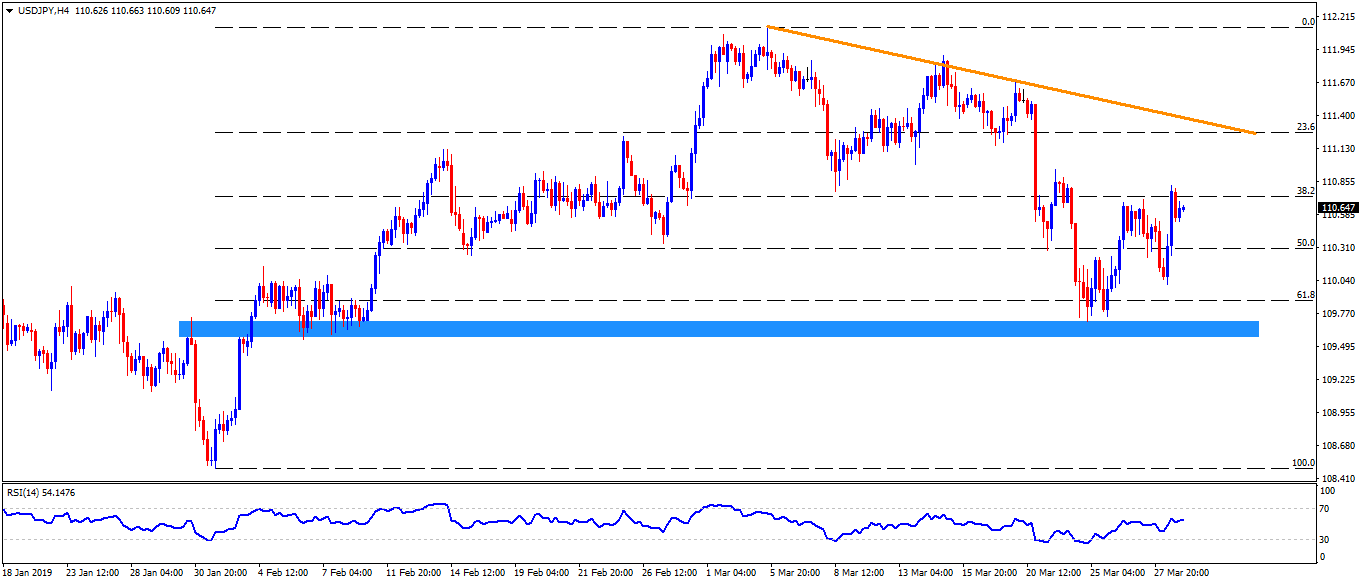
USD/JPY 4-Hour chart
- 111.60 could offer an intermediate rest to the pair’s rise between 111.45 and 111.70.
- 109.70 – 109.60 area adds a filter to pair’s declines past 109.80.
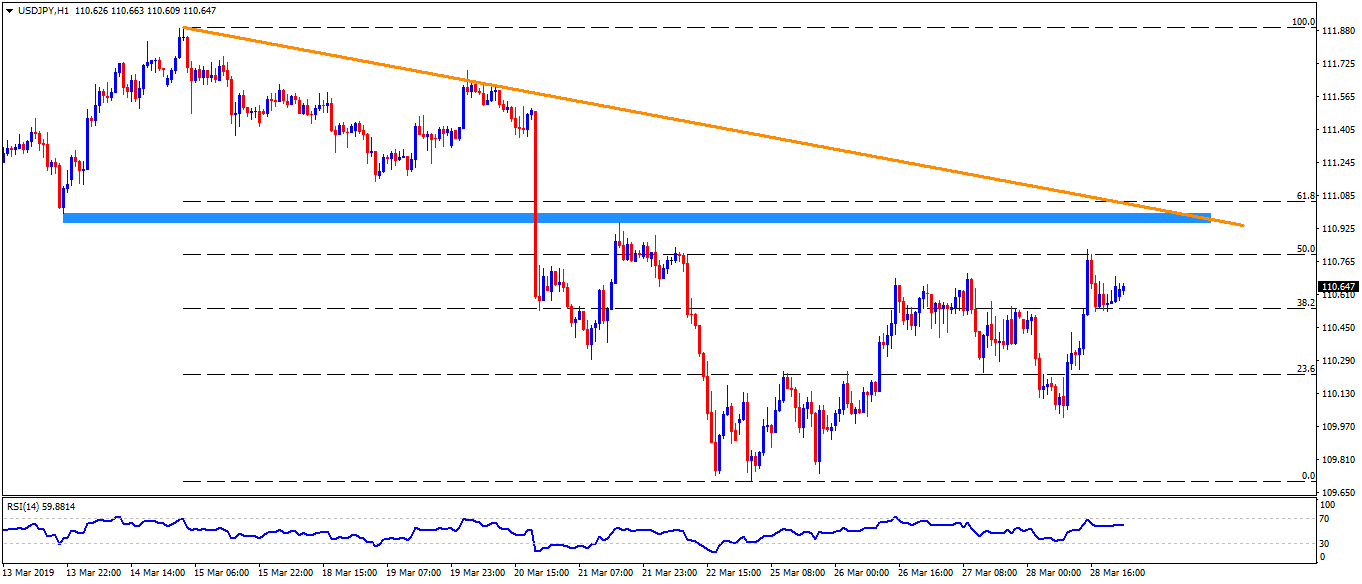
USD/JPY hourly chart
- Not only the two-week old horizontal region but a descending trend-line from March 15 also highlights the importance of 111.00 – 111.10 resistance-area.
- Alternatively, 110.30 can act as a buffer between 110.50 and 110.00.