- AUD/JPY is on the bids around 78.35 during early Friday.
- The pair responded positively to the recent data from Japan.
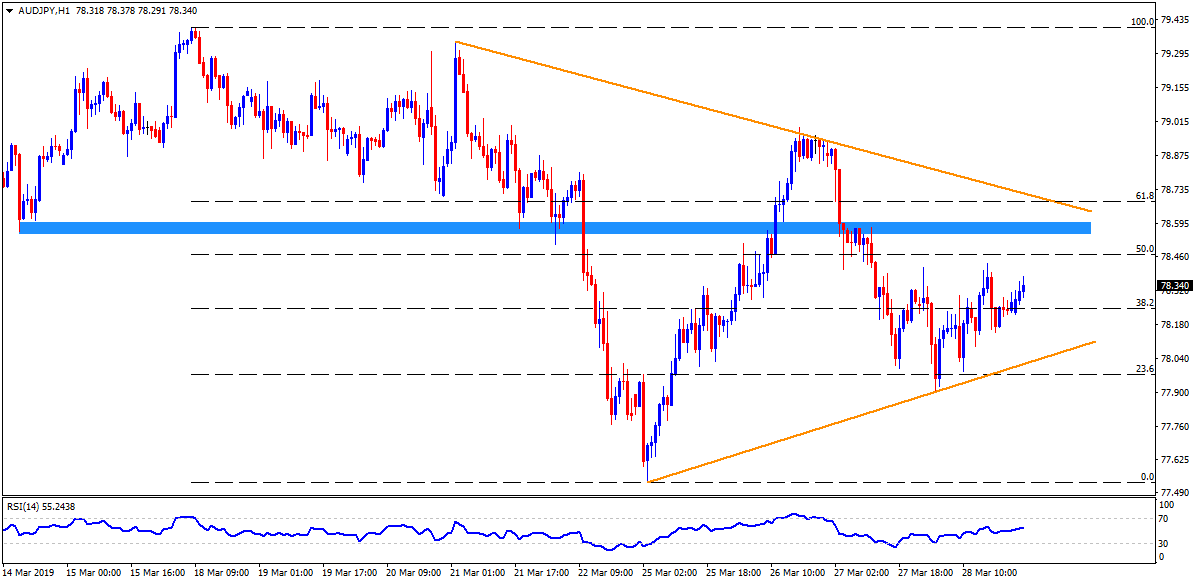
- 50% Fibonacci retracement of March 18-25 decline, at 78.50, could provide immediate resistance to the pair during its further advances. However, a horizontal-region around 78.55-60 could challenge buyers afterward.
- In a case where the quote manages to cross 78.60, a week-long symmetrical triangle formation comes into play. Herein the resistance-line that joins the highs since March 21 can restrict upside at 78.75.
- Should bulls dominate past-78.75, 79.00, 79.30 and 79.45-50 might become their favorites.
- Meanwhile, 78.15 may offer immediate support to the pair ahead of highlighting triangle support stretched since March 25, at 78.00.
- During the pair’s decline under 78.00, 77.80 and 77.50 could reappear on the chart.
AUD/JPY hourly chart