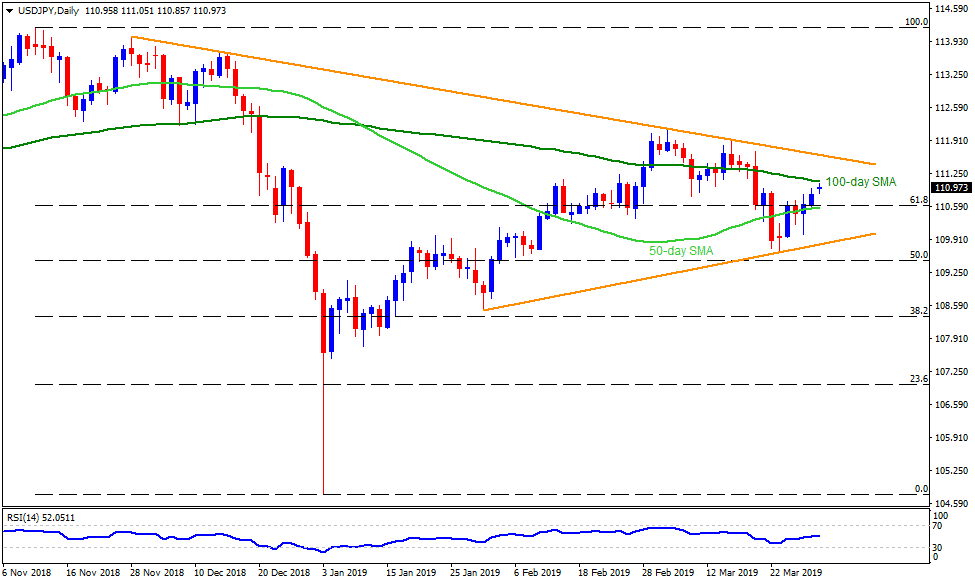
USD/JPY daily chart
- USD/JPY trades near 111.00 during initial Asian trading hours on Monday.
- The quote recently took a U-turn from 100-day simple moving average (SMA) figure of 111.10, which in turn signal the brighter chances of its pullback to 110.60-55 support-zone including 50-day SMA and 61.8% Fibonacci retracement of November 2018 to January 2019 decline.
- Given the pair’s refrain from respecting 110.55 support, 110.30 and 110.00 could appear on sellers’ radar.
- Though, an ascending support-line connecting January 31 low to March low, at 109.80, might be of a question for bears to solve if they’re aiming for 109.30 and 109.00 supports.
- Alternatively, an upside clearance of 111.10 can propel prices toward the four-month-old downward sloping trend-line resistance figure of 111.70.
- During the pair’s further increase post-111.70, 112.20-30 and 113.00 could become buyers’ favorites.
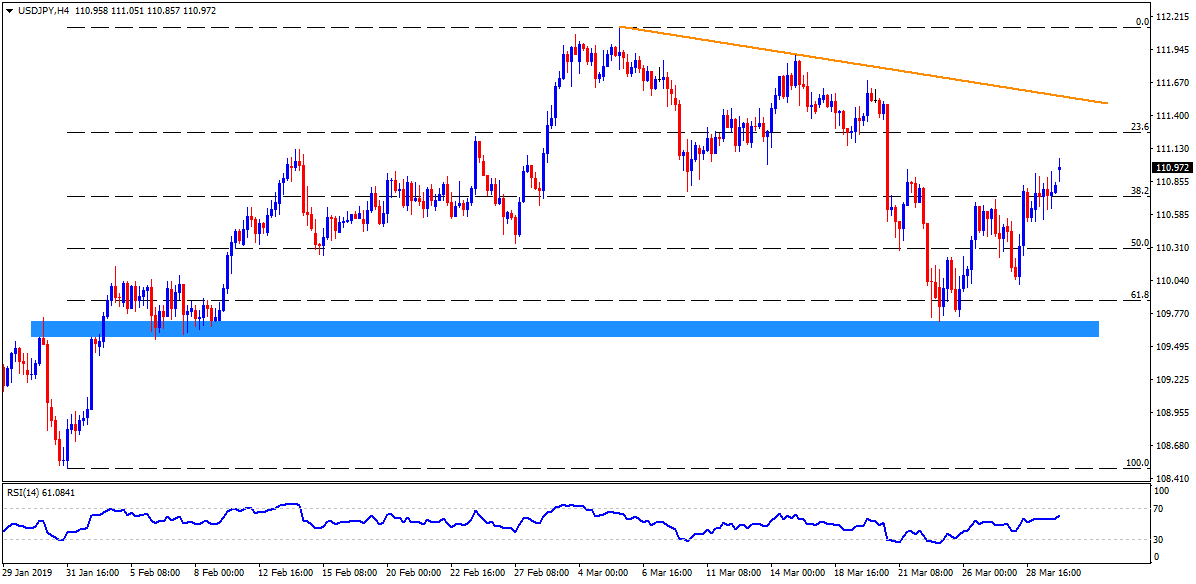
USD/JPY 4-Hour chart
- A four-week-old descending trend-line can act as intermediate halt around 111.60 between the pair’s rise after 100-day SMA breakout and ahead of 111.70 resistance-line.
- On the downside, 50% Fibonacci retracement level of 110.30 and 109.70-60 region are some additional supports to watch.
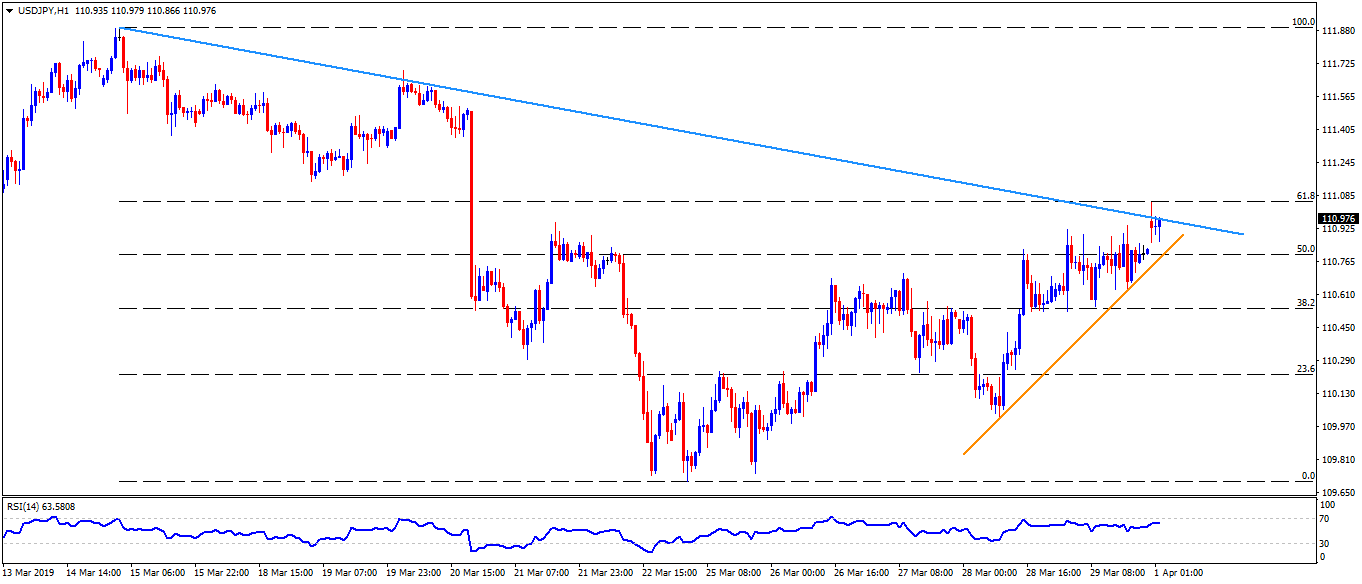
USD/JPY hourly chart
- An immediate upward sloping support-line at 110.80 can offer the closest support to prices followed by 110.60 and 110.30.
- 111.20 may validate the quote’s upside past-111.10 to aim for 111.60 and 111.70.