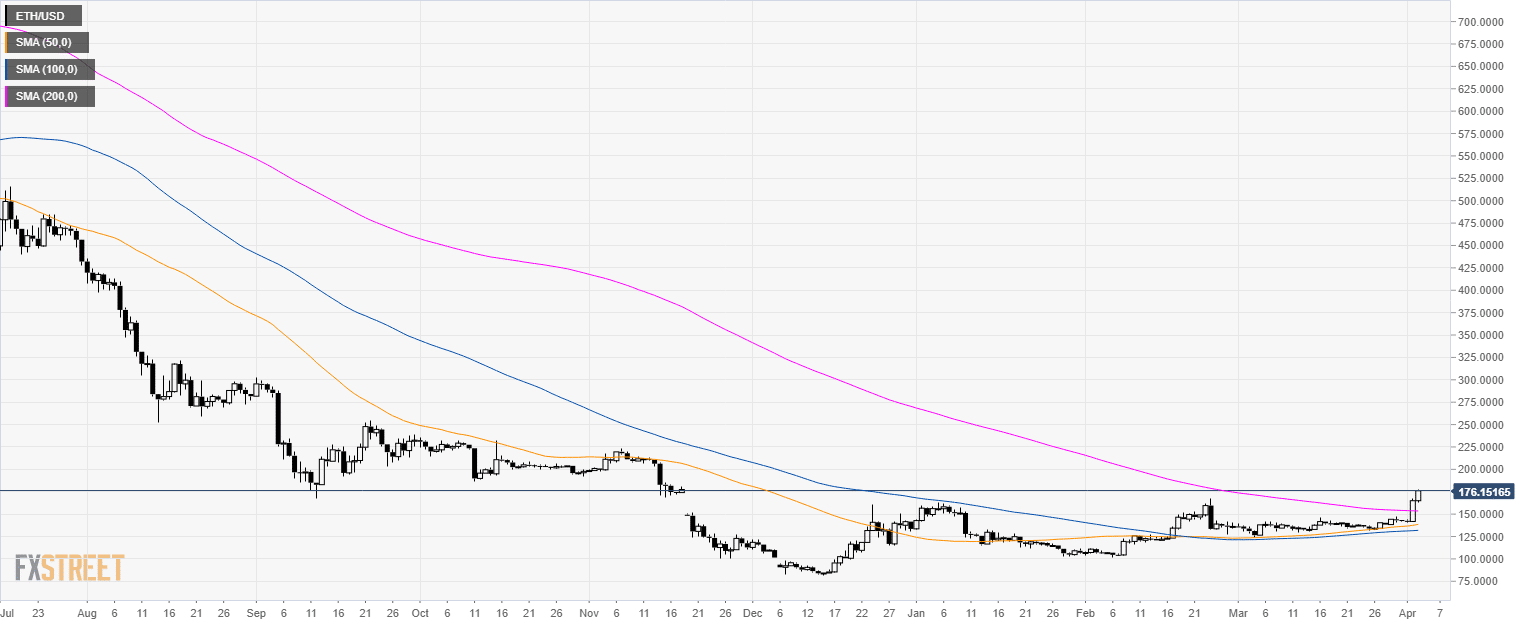
Home ETH/USD Technical Analysis: Ethereum surges above the 200 DSMA and approaches the 180.00 level
FXStreet News

ETH/USD Technical Analysis: Ethereum surges above the 200 DSMA and approaches the 180.00 level

ETH/USD daily chart

  • ETH/USD broke above its 200-day simple moving average (SMA) suggesting that a bull market in the cryptocurrency can be around the corner.


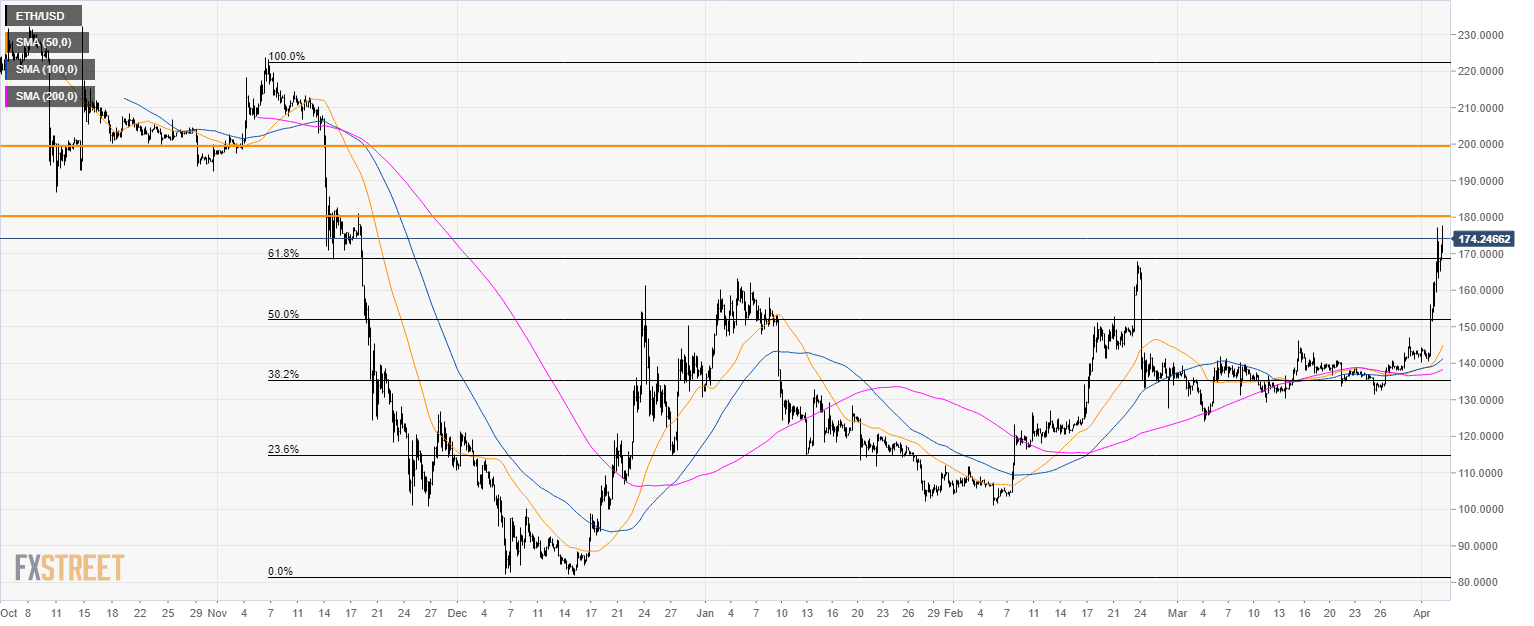
ETH/USD 4-hour chart

  • ETH/USD is trading above its main SMAs suggesting a bullish bias in the medium-term.
  • The level to break for bulls is 180.00 followed by 200.00 and 220.00 resistances.
  • Support are seen at 170.00, 150.00 and 135.00 level.


Additional key levels

FX Street

FX Street

FXStreet is the leading independent portal dedicated to the Foreign Exchange (Forex) market. It was launched in 2000 and the portal has always been proud of their unyielding commitment to provide objective and unbiased information, to enable their users to take better and more confident decisions.