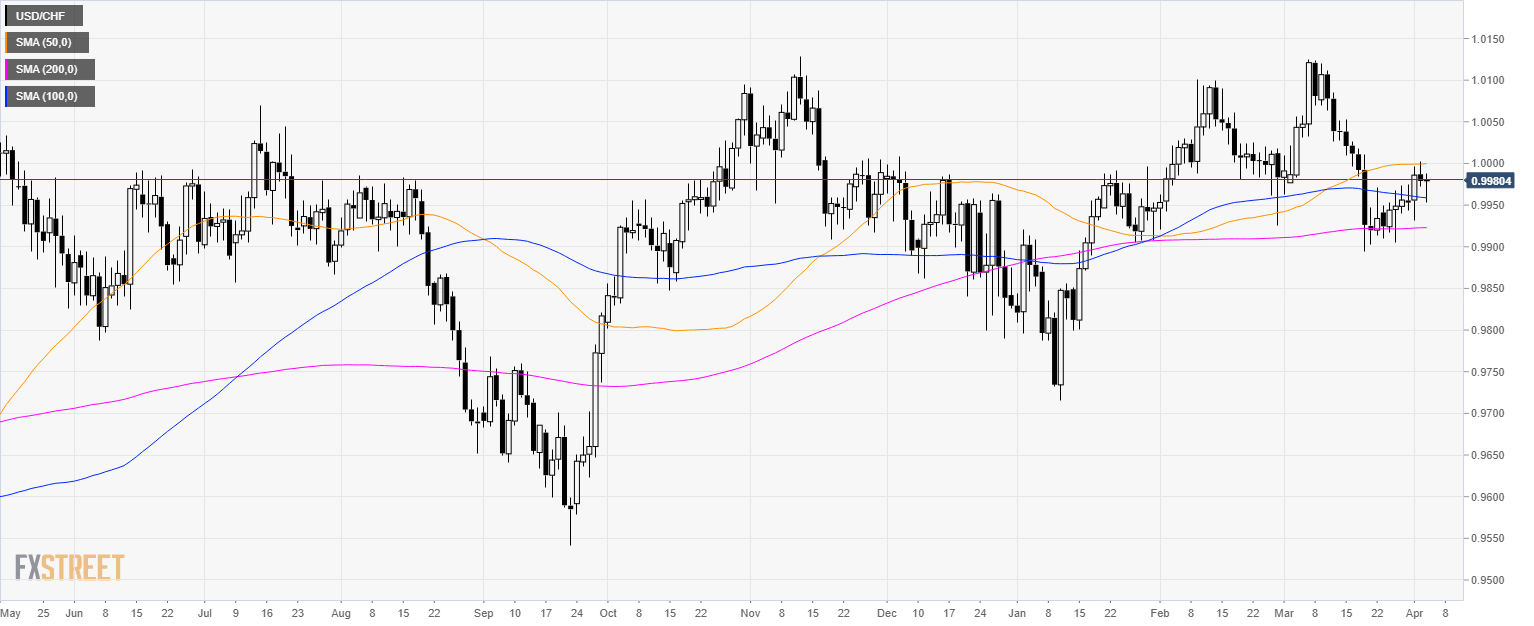
USD/CHF daily chart
- USD/CHF is trading in a sideways trend just below the parity level.
- USD/CHF needs a bullish break above 1.0005 resistance to regain some directionality.
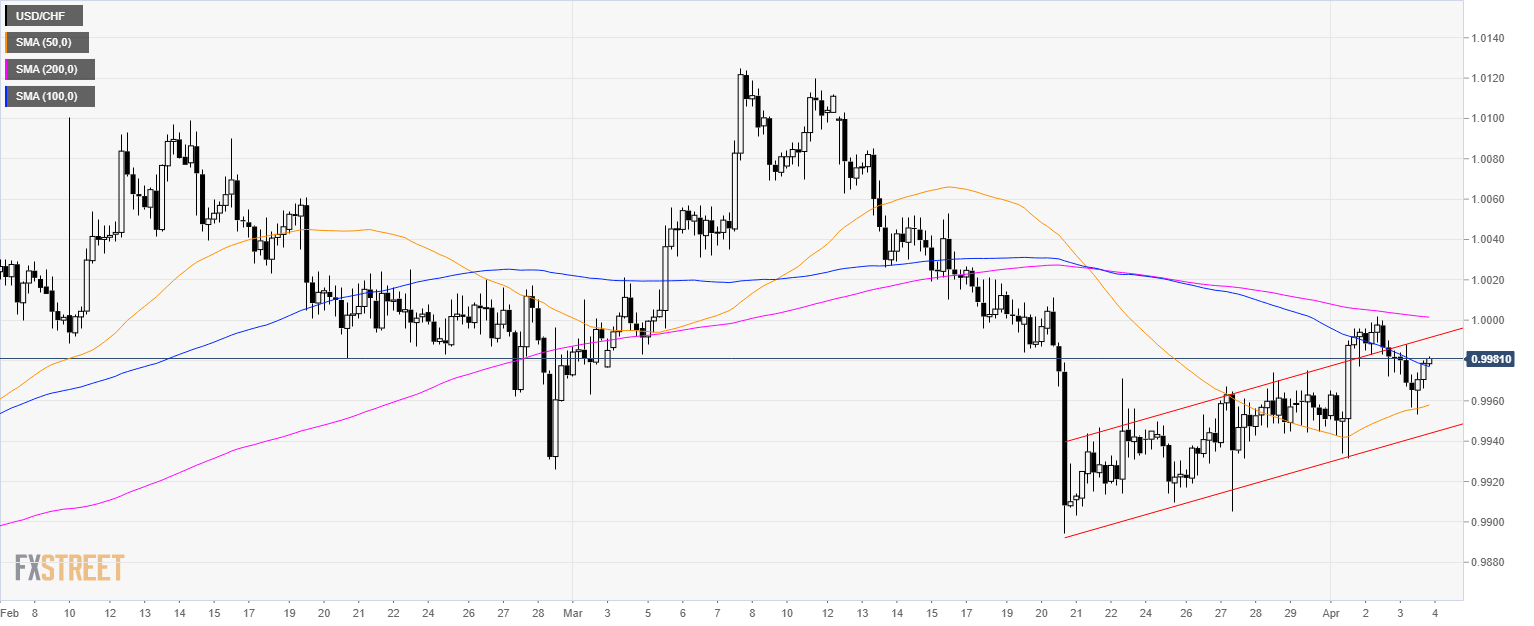
USD/CHF 4-hour chart
- USD/CHF is trading in a bull channel below a rather flat 200 SMA.
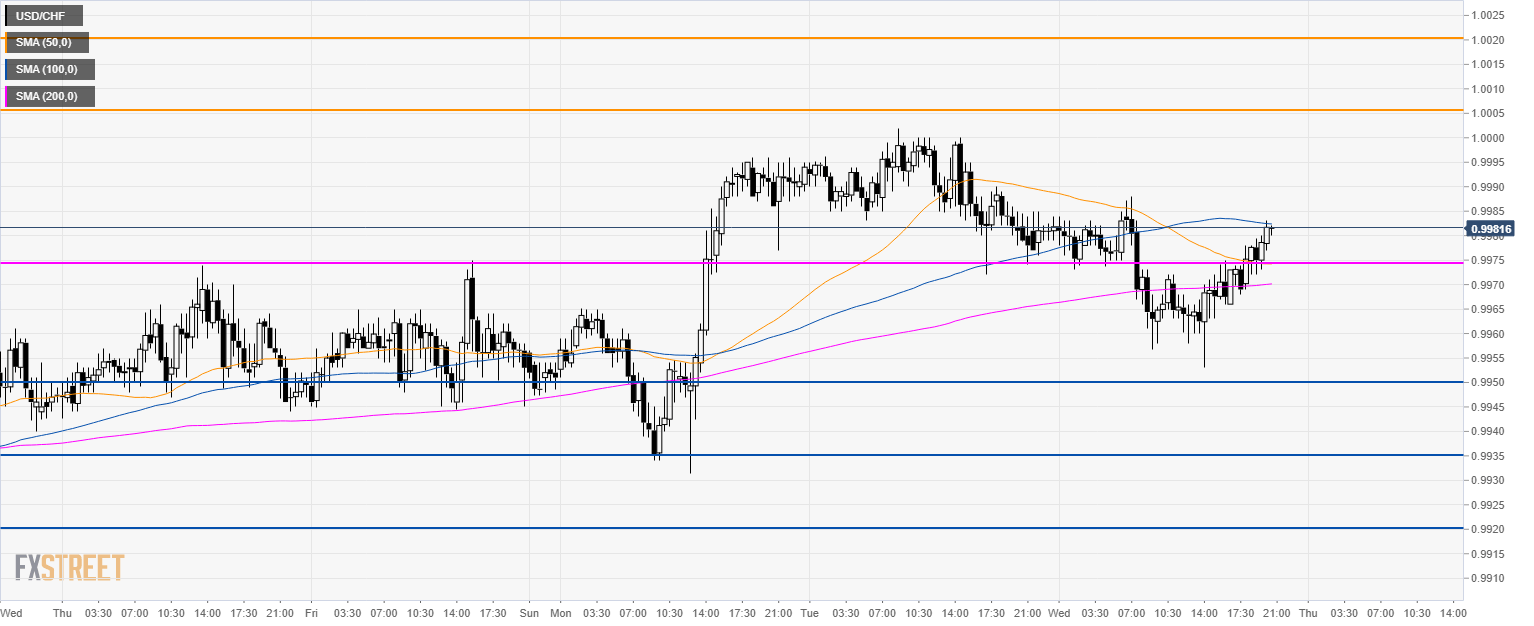
USD/CHF 30-minute chart
- USD/CHF is trading above the 200 SMA suggesting a bullish bias in the short-term.
- The key level to beat for bulls is the 1.0005 resistance. After which comes the 1.0020 and 1.0035 level.
- On the way down, immediate support is at 0.9975, 0.9950 and 0.9935 level.
Additional key levels
