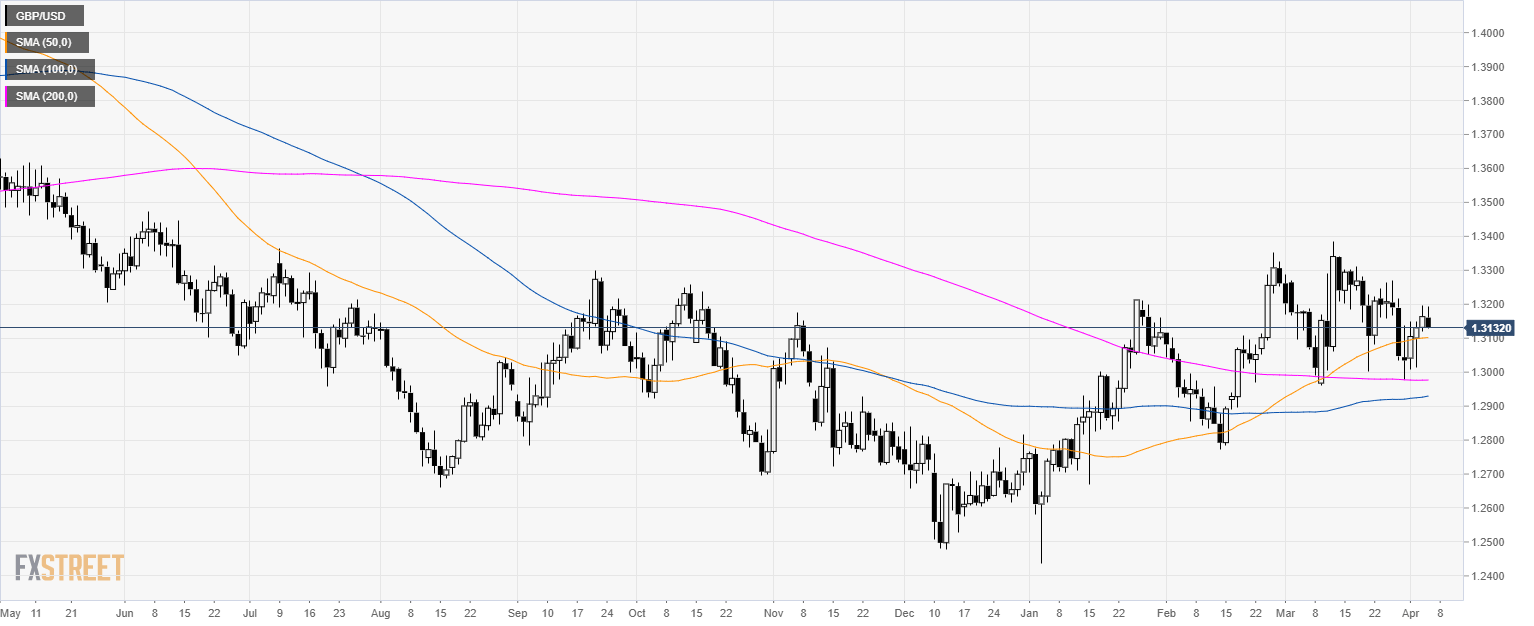
GBP/USD daily chart
- GBP/USD is consolidating yesterday’s modest gains above the 200-day simple moving average (SMA).
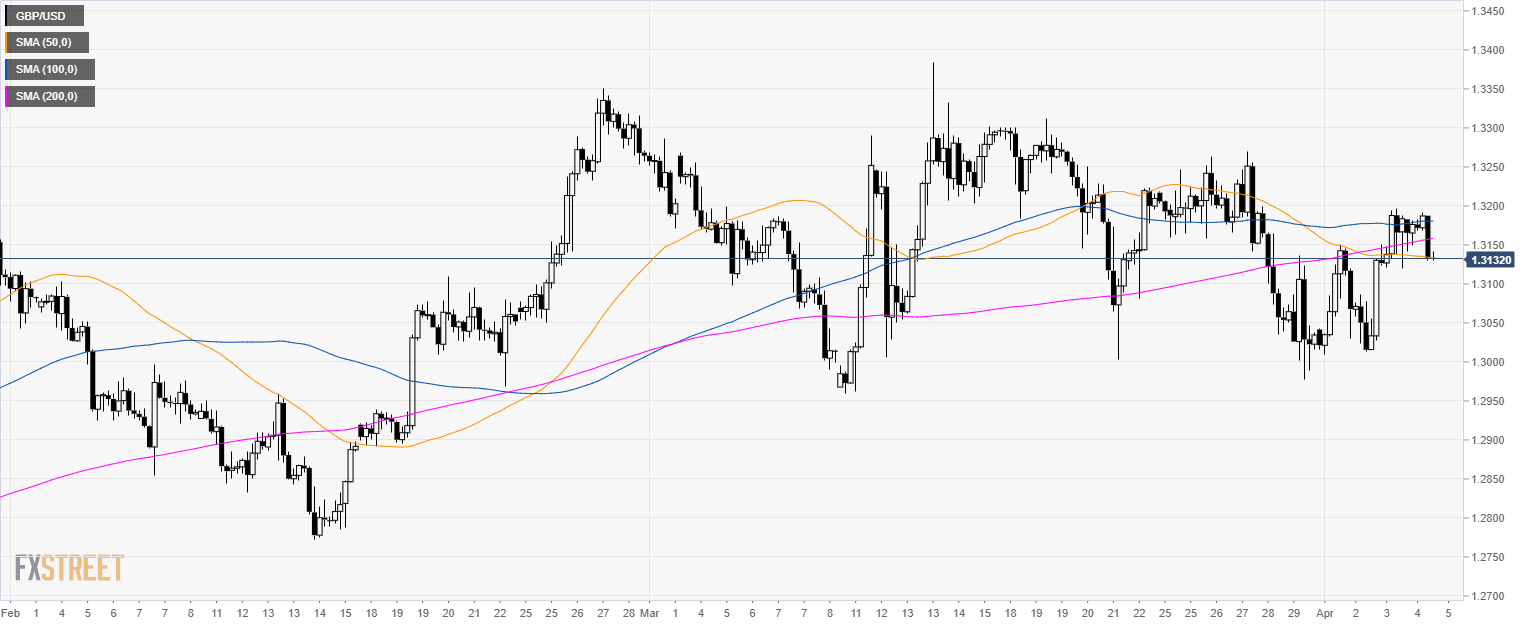
GBP/USD 4-hour chart
- GBP/USD is breaking below 1.3150 and its main SMAs.
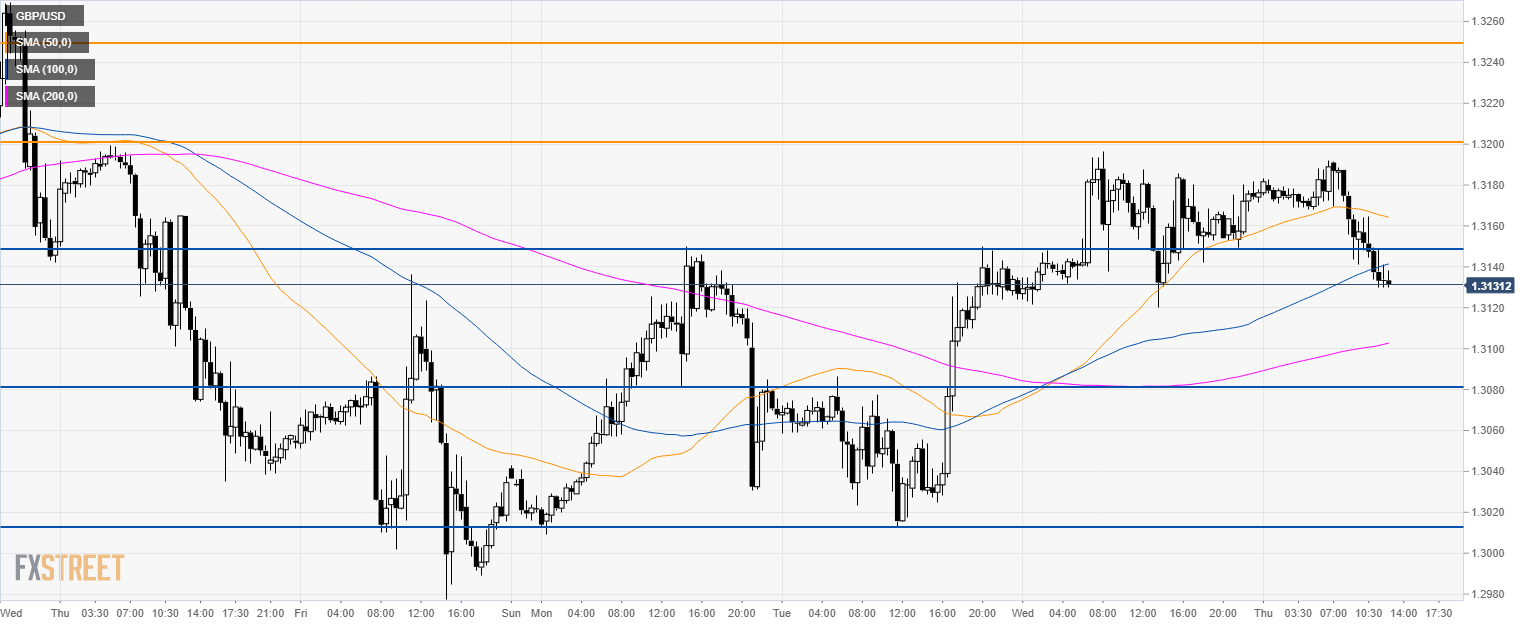
GBP/USD 30-minute chart
- GBP/USD is trading at daily lows as the market is trying to reach the 1.3080 support. The next level of interest to the downside is the 1.3010 level.
- To the upside, resistance is at 1.3200 and 1.3250 level.
Additional key levels
