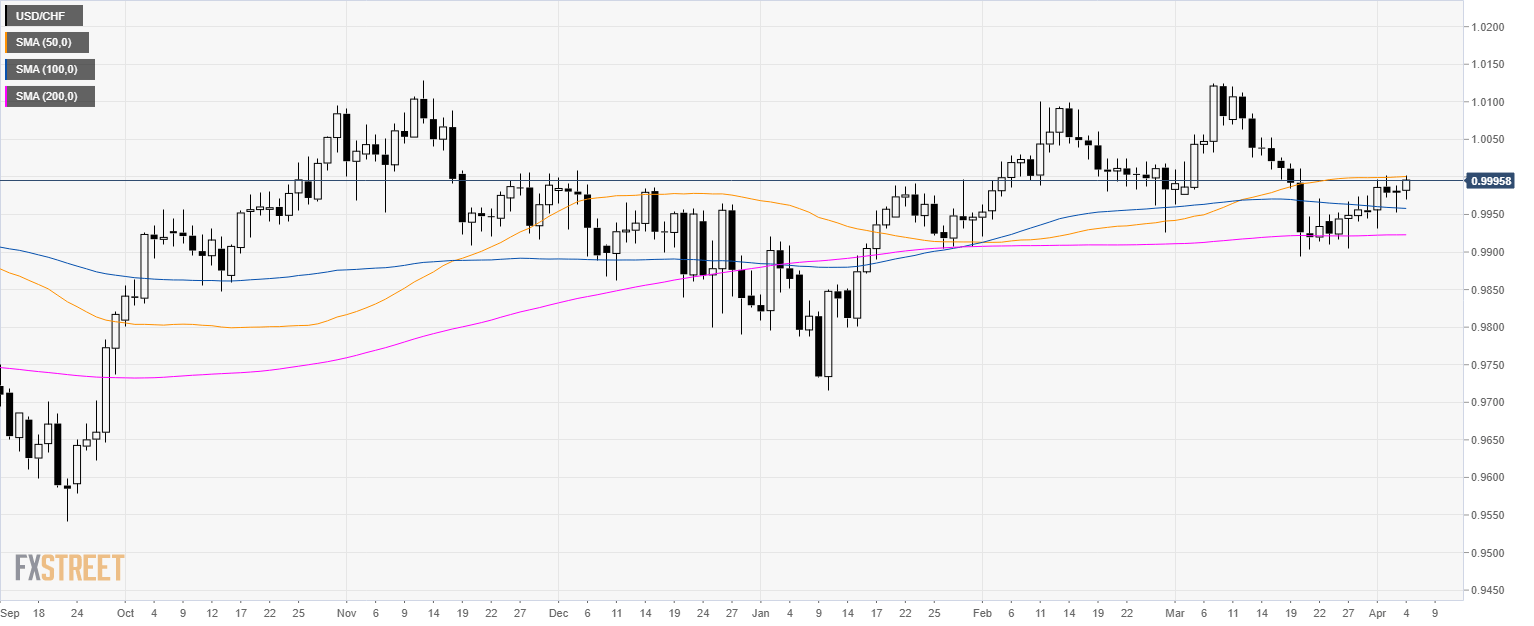
USD/CHF daily chart
- USD/CHF is trading in a bull trend just below the parity level.
- USD/CHF is testing the 50 SMA.
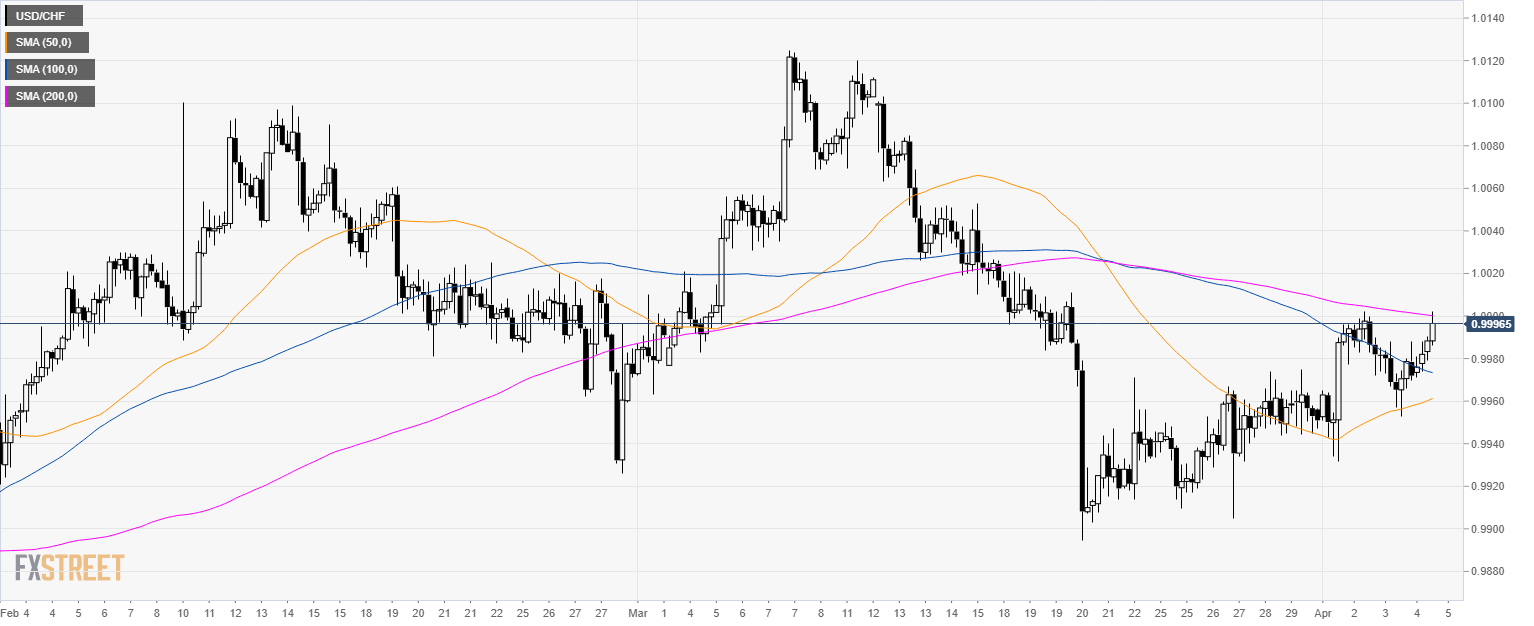
USD/CHF 4-hour chart
- USD/CHF is testing the parity level and the 200 SMA.
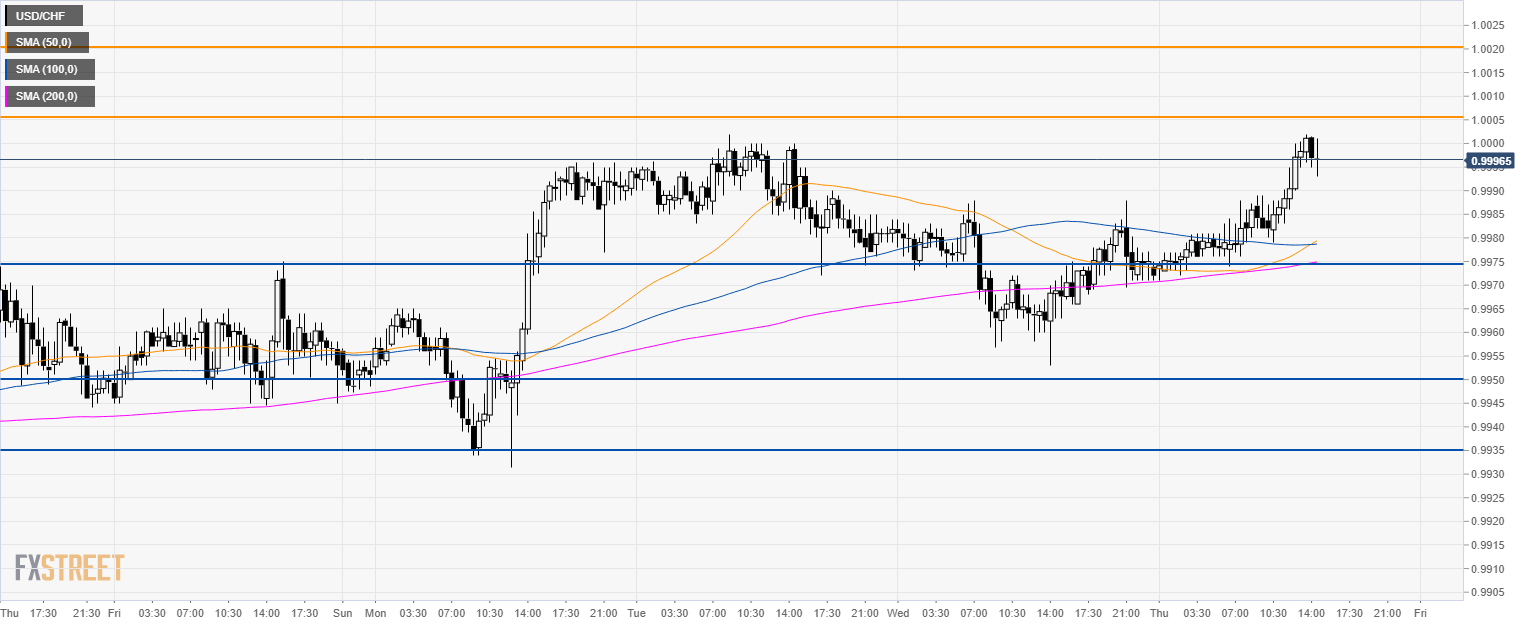
USD/CHF 30-minute chart
- USD/CHF is trading above the 200 SMA suggesting a bullish bias in the short-term.
- Bulls will need to break the 1.0005 key resistance. The next resistances in line are at 1.0020 and 1.0035 level.
- Looking to the downside, immediate support is at 0.9975, 0.9950 and 0.9935 level.
Additional key levels
