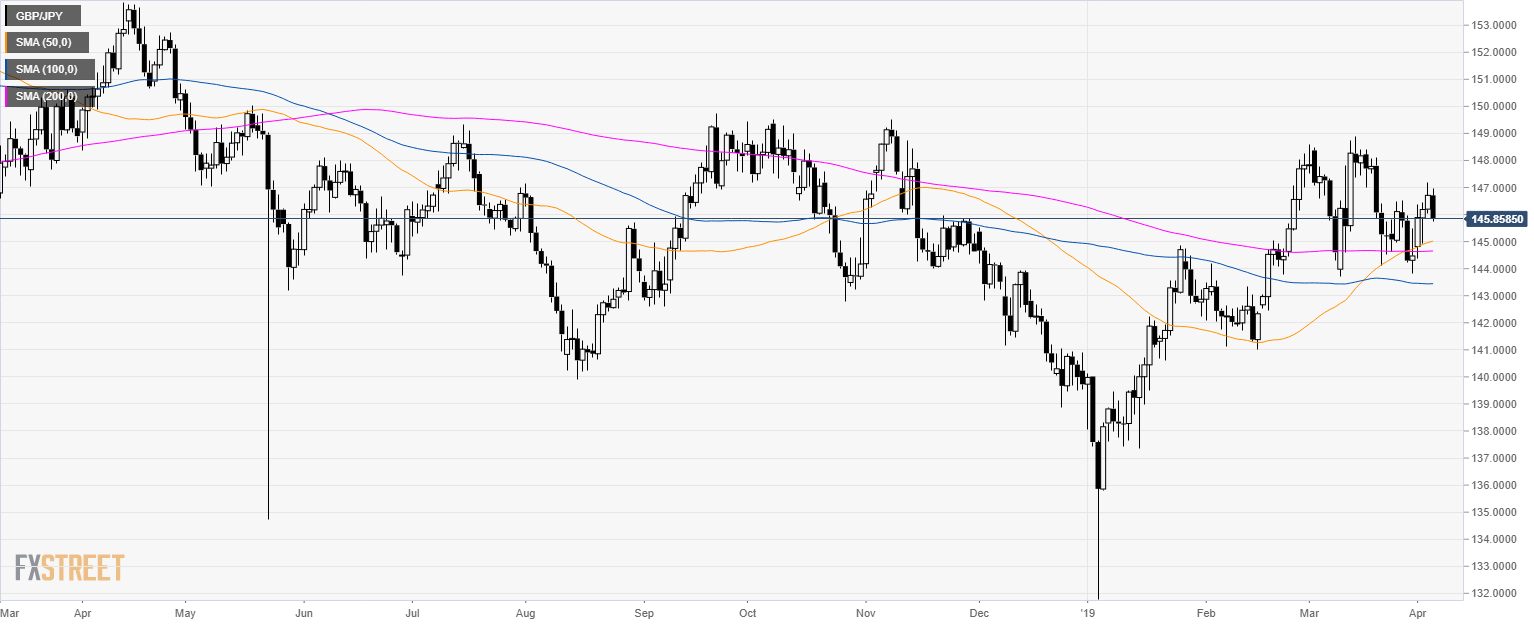
GBP/JPY daily chart
- GBP/JPY is consolidating above its 200-day simple moving averages (SMA).
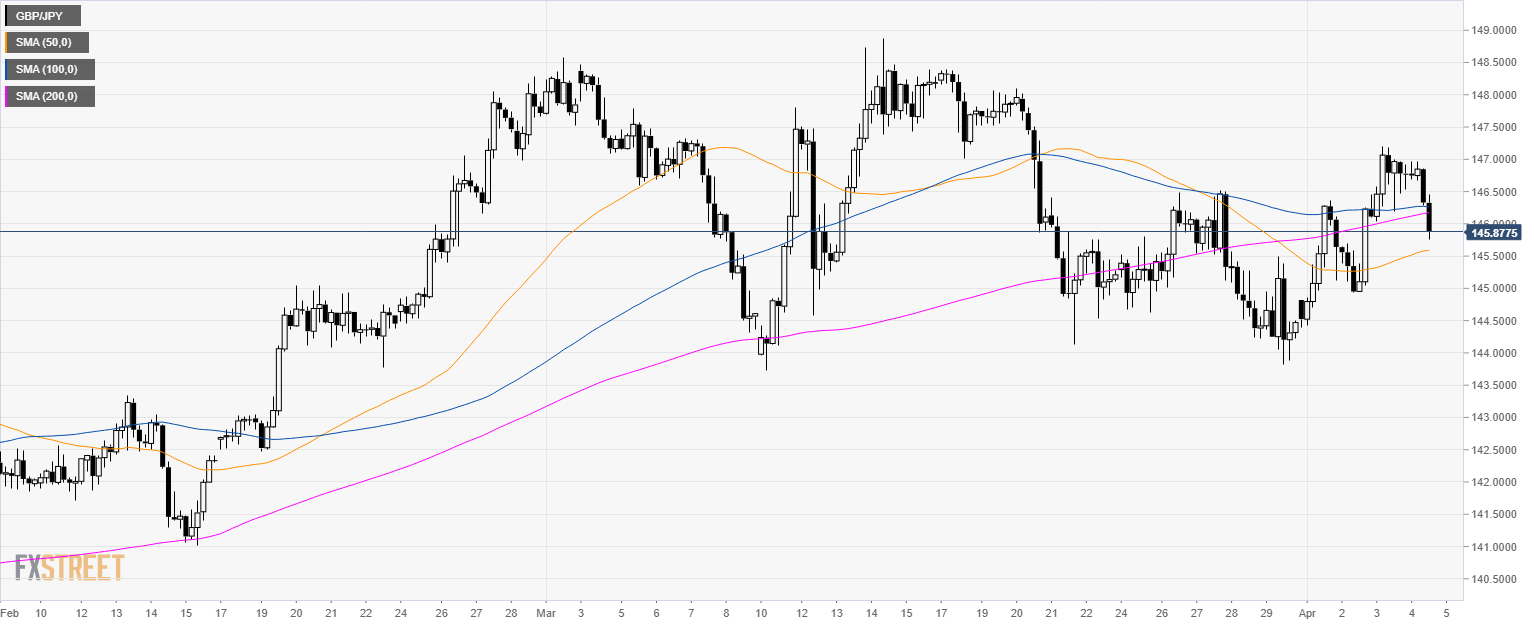
GBP/JPY 4-hour chart
- GBP/JPY is trading below its 100 and 200 SMA suggesting a bearish bias in the short-term.
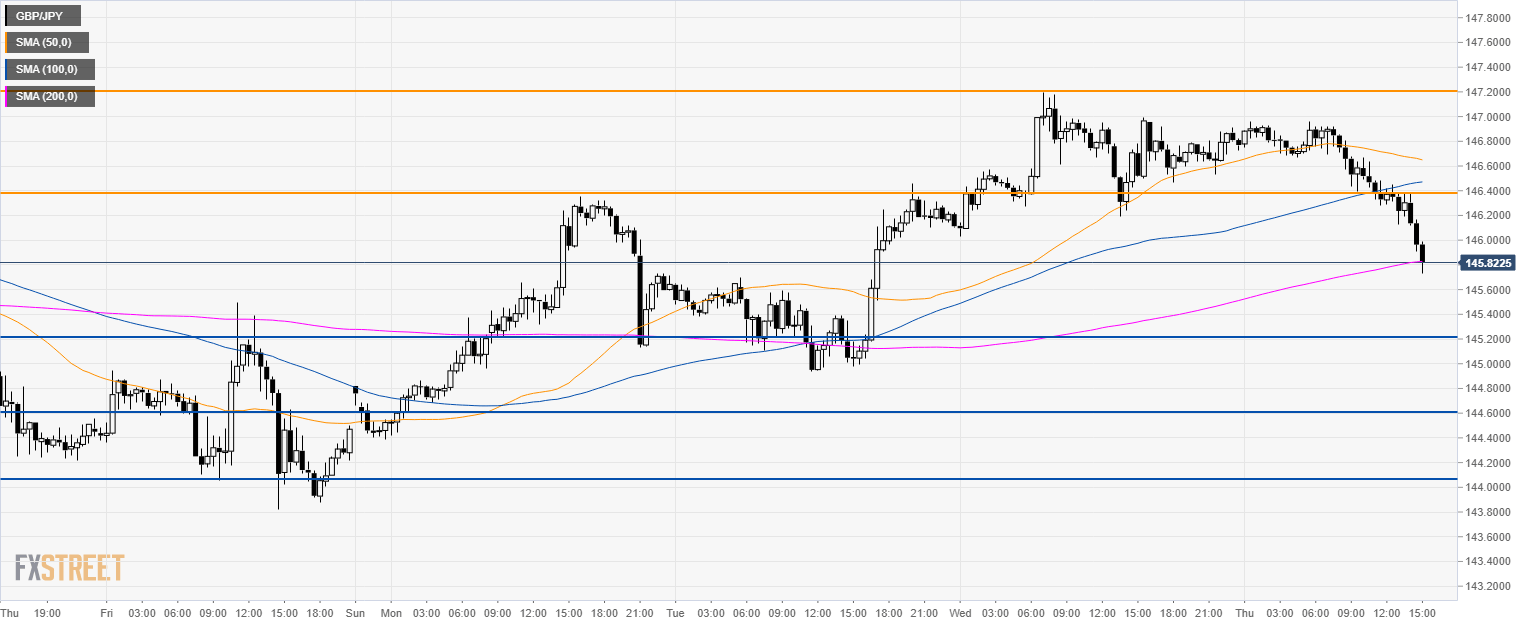
GBP/JPY 30-minute chart
- GBP/JPY is falling below the 100 and 200 SMA suggesting a bearish momentum in the short-term.
- Bears are looking at the 145.20 and 144.60 support.
- Resistances are at 146.40 and 147.20 level.
Additional key levels
