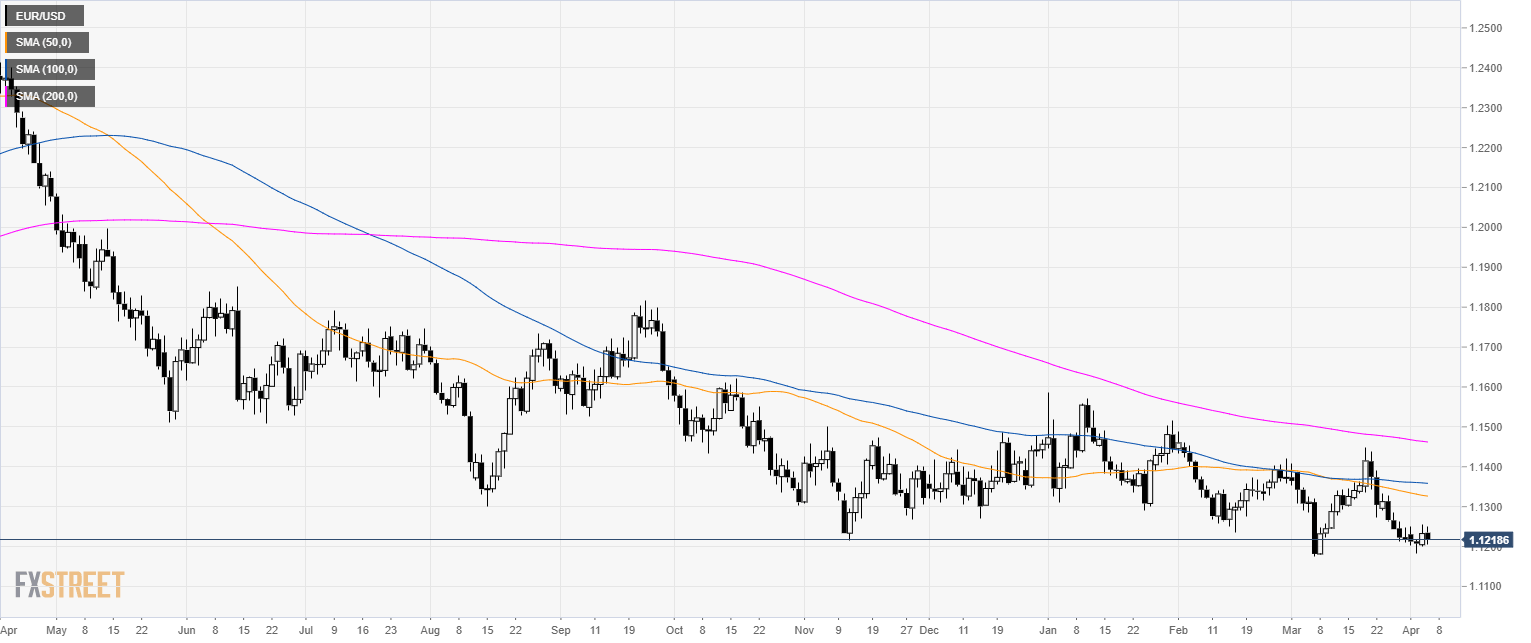
EUR/USD daily chart
- EUR/USD is trading in a bear trend below its 200-day simple moving average (SMA).
- As mentioned yesterday, EUR/USD dropped towards the 1.1220 level.
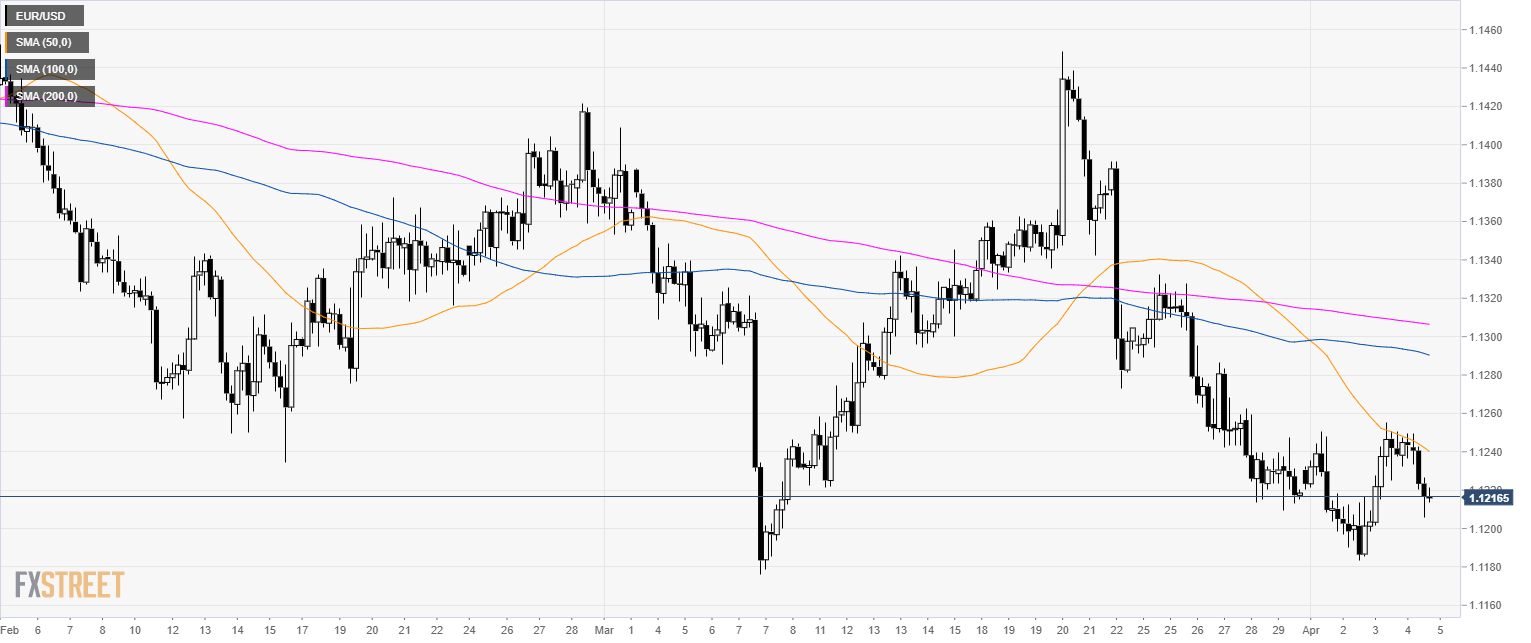
EUR/USD 4-hour chart
- EUR/USD is trading below its main SMAs suggesting a bearish bias in the medium-term.
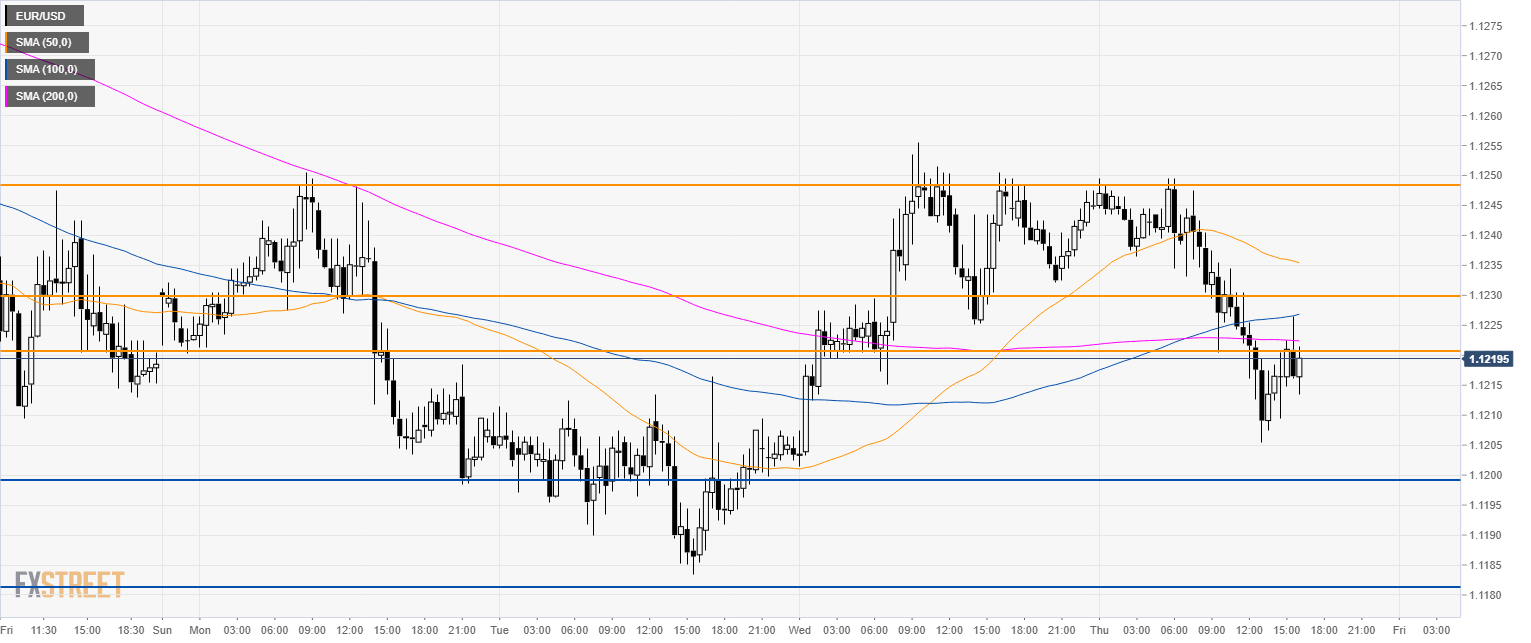
EUR/USD 30-minute chart
- EUR/USD is trading below its main SMAs suggesting a bearish momentum in the short-term.
- As long as the single currency stays below 1.1250 key resistance, EUR/USD remains exposed to 1.1200 and 1.1800 support to the downside.
- On the way up, 1.1230 can act as resistance.
Additional key levels
