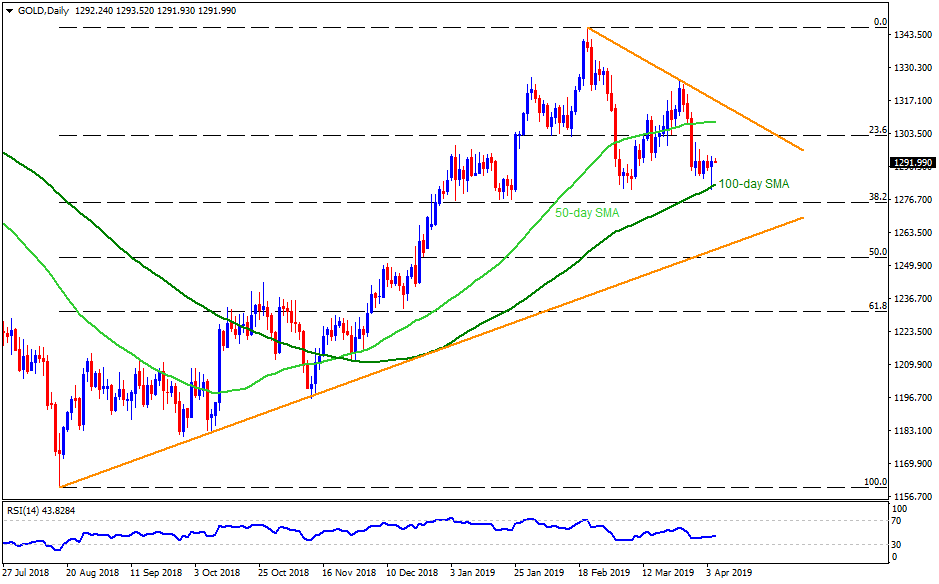
Gold daily chart
- Having bounced off 100-day simple moving average (SMA), Gold is on the bids around $1292.50 during early Asian session on Friday.
- Considering the recent pullback, the yellow metal may now aim for $1300 round-figure ahead of confronting 23.6% Fibonacci retracement of August 2018 to February 2019 upside near $1303 and 50-day SMA level of $1308. However, a downward sloping trend-line connecting February and March high, at $1317, could challenge buyers then after.
- Alternatively, a daily close under 100-day SMA, at $1282 now, may need validation through $1280 in order to visit 38.2% Fibonacci retracement level of $1275, a break of which can recall $1266 ahead of highlighting eight-month-old support-line at $1257 now.
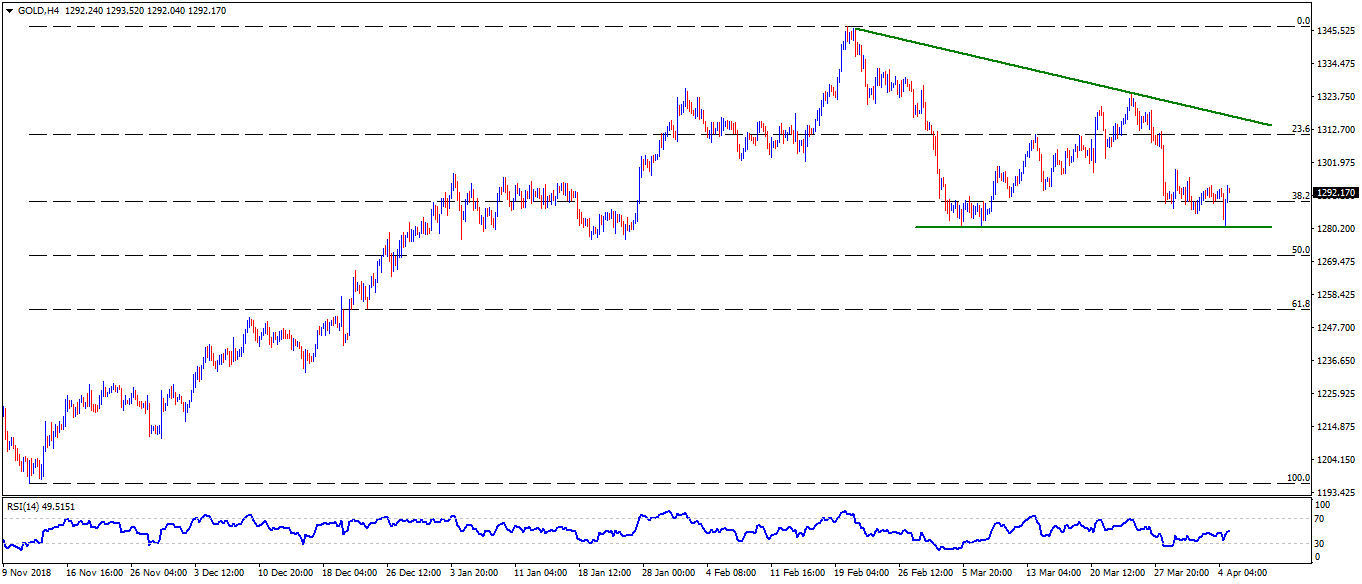
Gold 4-Hour chart
- 23.6% Fibonacci retracement of November 2018 to February rise at $1311 can act as an intermediate halt between $1308 and $1317.
- Also, $1251 and $1233 are additional supports past-$1257.
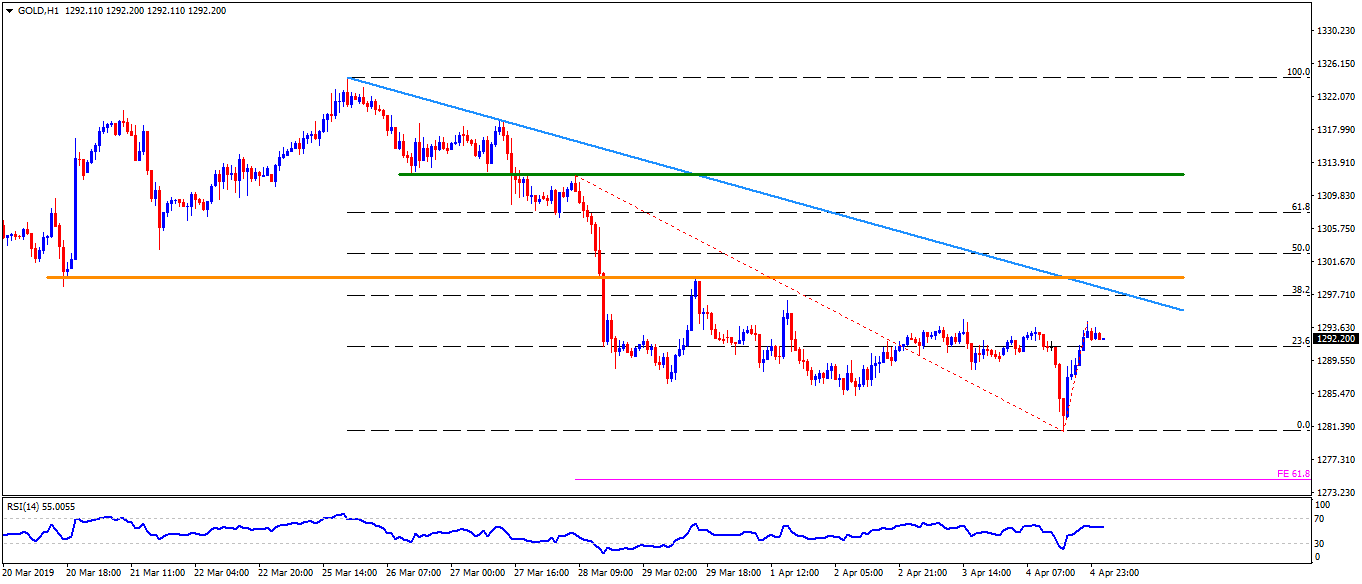
Gold hourly chart
- Current month high near $1297 may offer the closest resistance during further advances.
- Meanwhile, $1285 could become adjacent rest-point to watch.