The IDR is basing on a strong level of support made up of a number of supporting lines dating all the way back to 2010, 2018 and 2019 as can be seen in the cluster of trendlines meeting with a confluence of the 21-D SMA – (This is all located within the eclipse seen on the following-dated chart ahead of the 21.6% Fibo):

A break of the eclipse makes for a strong downside case towards the 38.2% and then 50% Fibo at 1180.
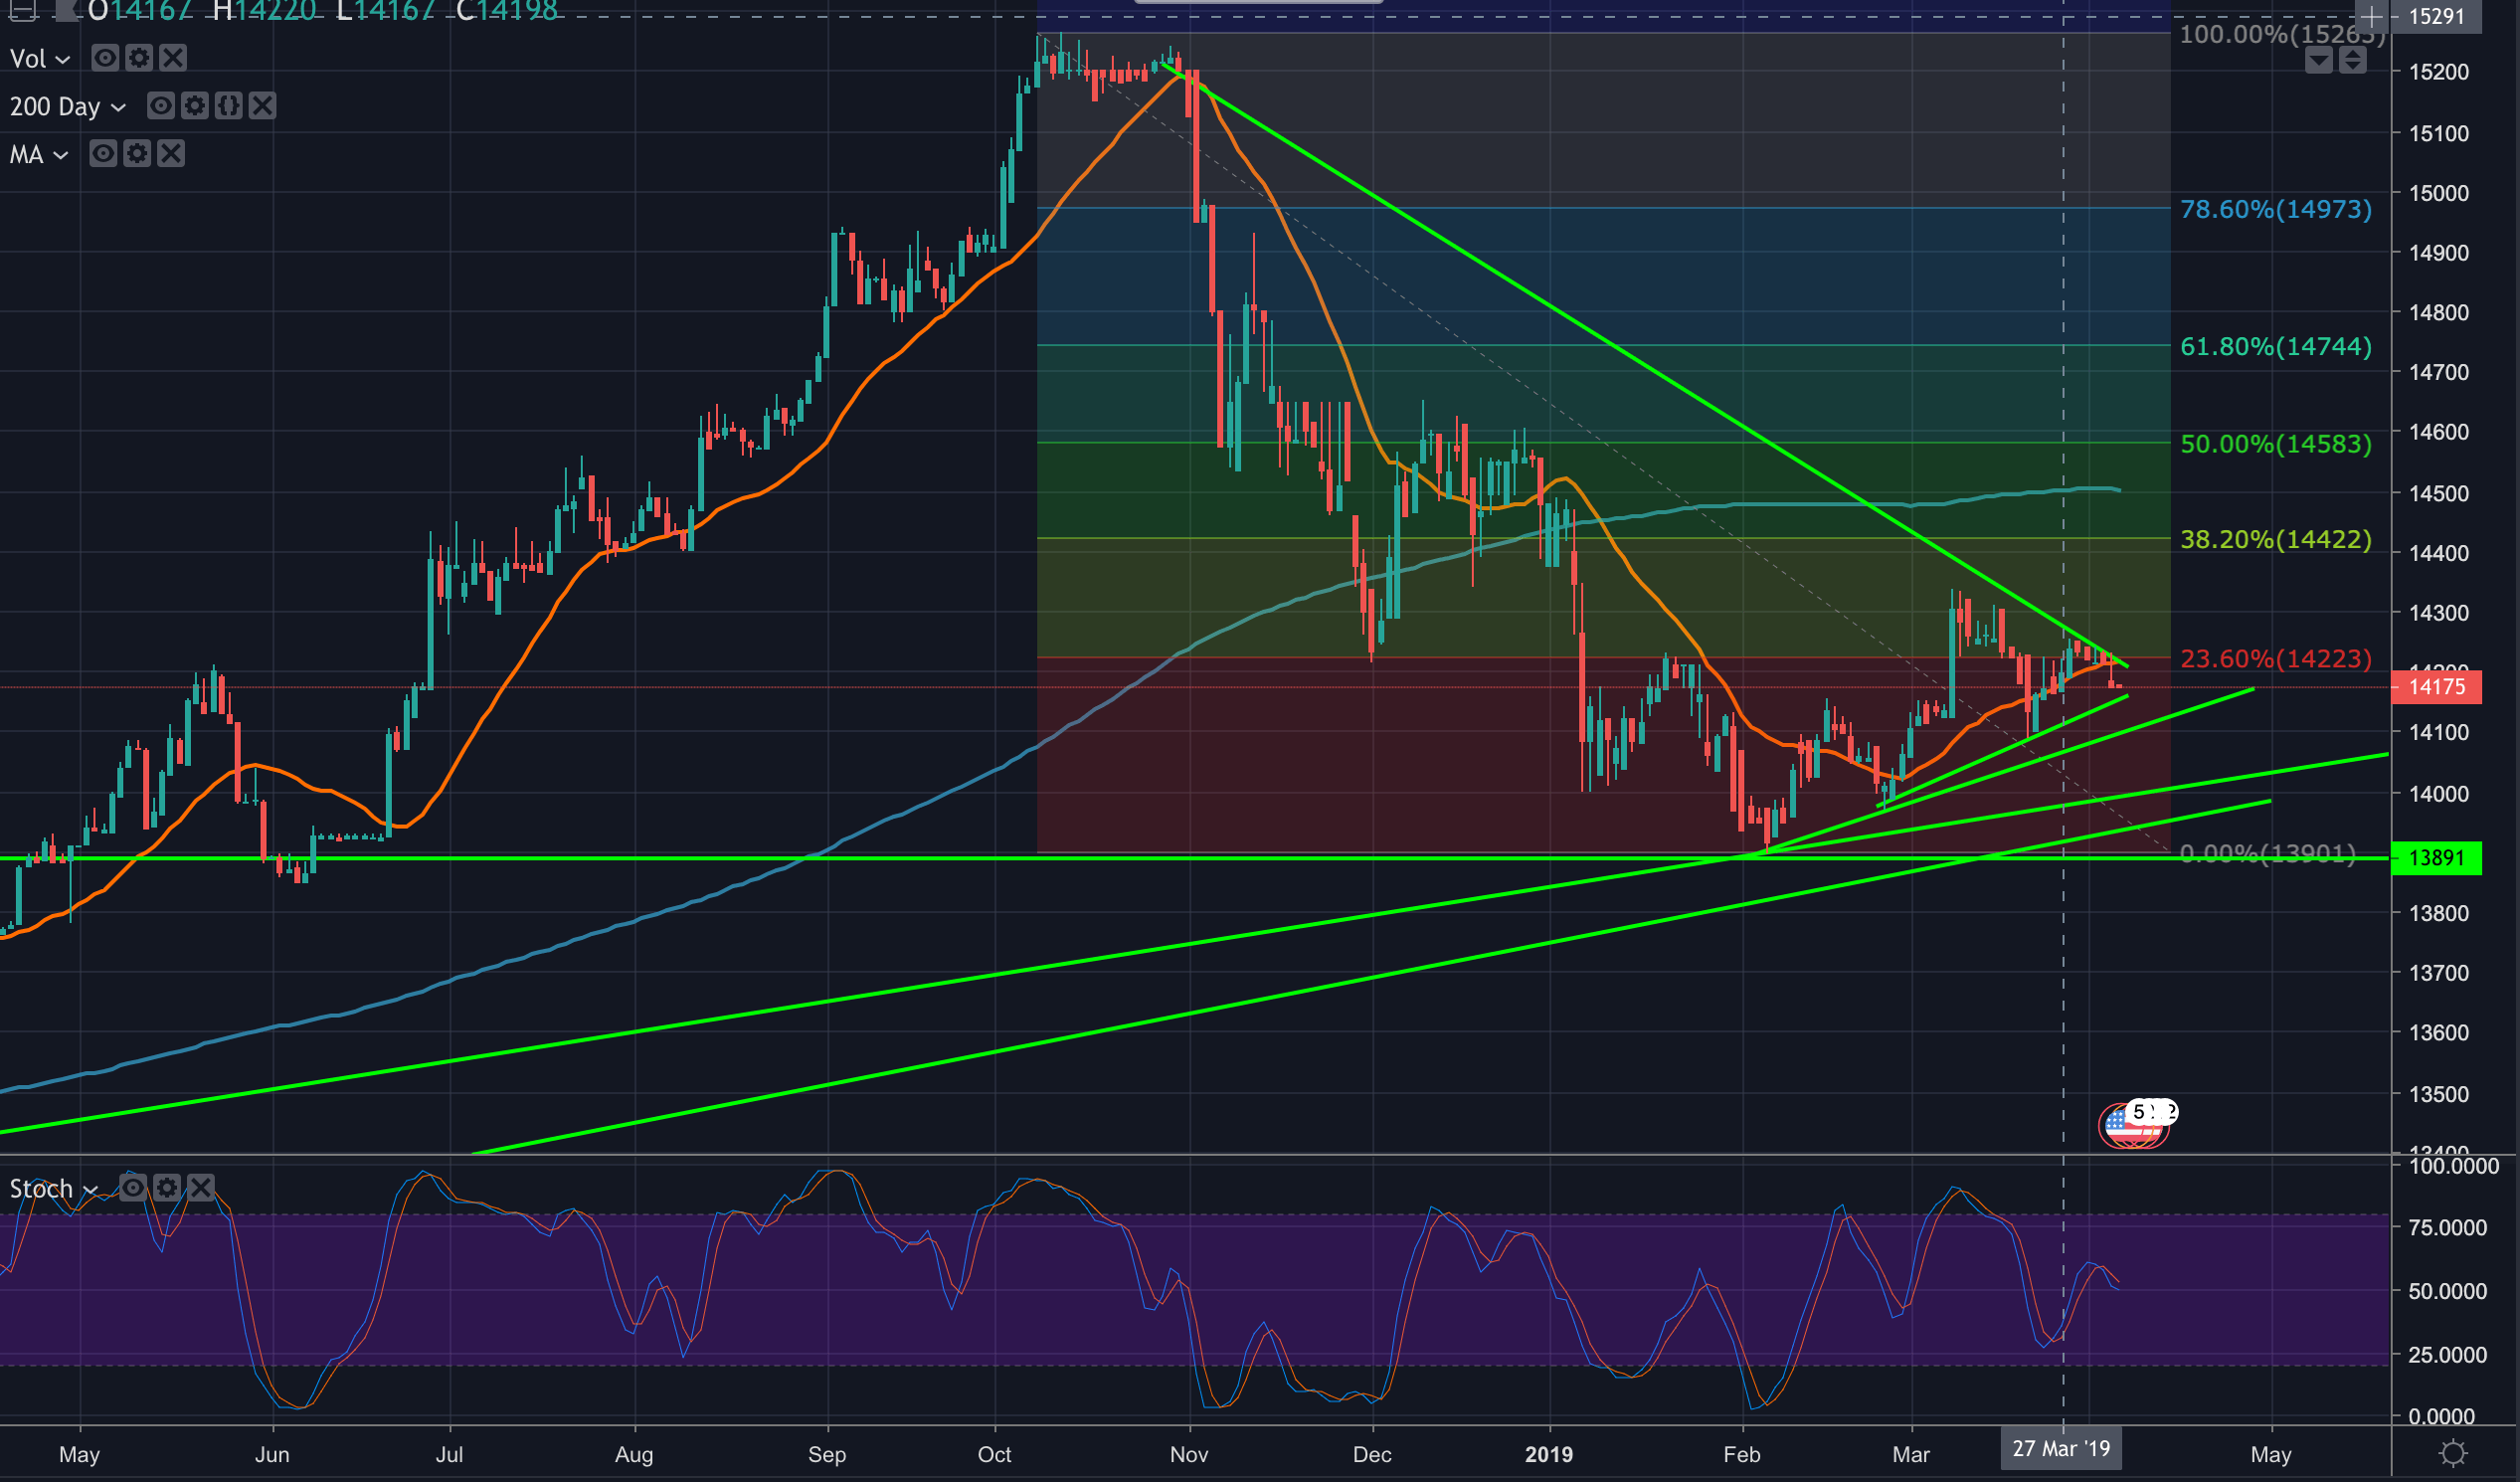
Zooming in, the trend-line support is clearer as the price struggles and bulls step in testing trend line resistance – Territory above the 23.6% Fibo of the Oct-Feb decline. A subsequent break of the trend line resistance opens the case for a run towards the 38.2% Fibo that guards the 200-D SMA (blue line on the chart).