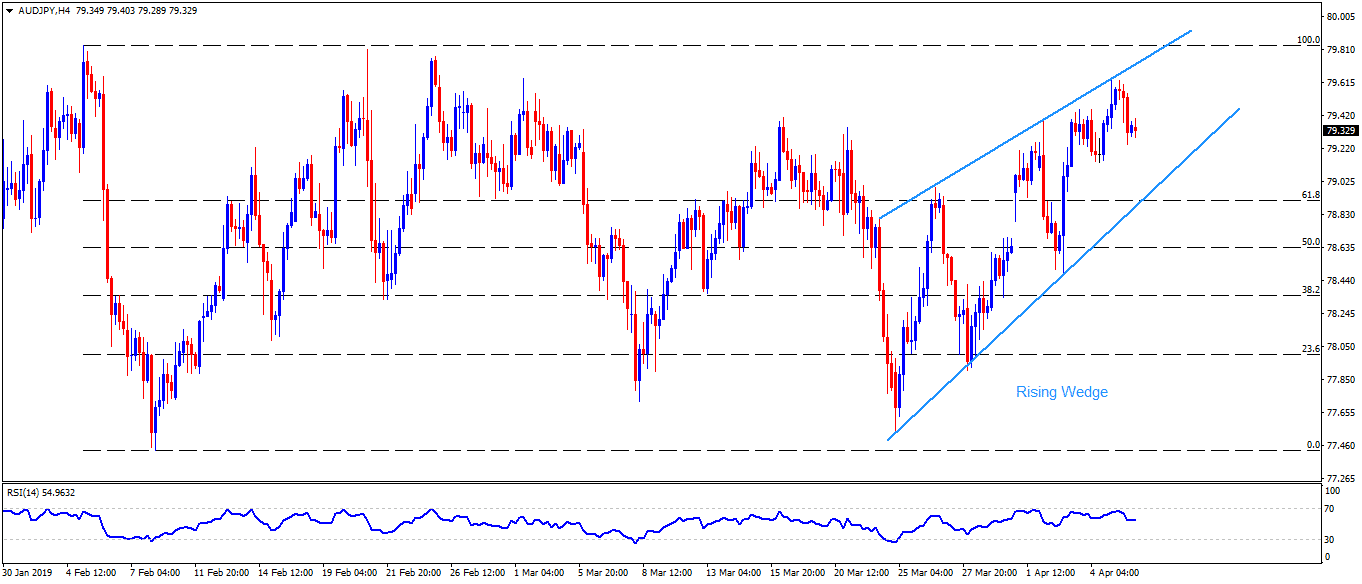
AUD/JPY trades near 79.30 during early Monday. The pair has been struggling around 100-day simple moving average (SMA) on the daily chart but has formed a short-term “rising wedge” trading pattern on the four-hour chart.
However, the pair needs to slip beneath the bearish formation support of 78.90 in order to confirm its theoretical decline till 77.60.
It should be noted that 50% Fibonacci retracement of its early-February downturn near 78.60, 78.00 and March 21 low around 77.90 could offer intermediate halts during the quote’s south-run to 77.60 after it breaks 78.90 support.
On the upside, 79.50 and 79.65 could restrict immediate advances whereas pattern resistance-line at 79.75 might challenge buyers then after.
If at all prices rally past-79.75, 80.00 and 200-day SMA level on the daily chart near 80.30 could appear on the Bulls’ radar to target.
AUD/JPY 4-Hour chart
Trend: Mildly Bearish
