USD/IDR is trading near 14,150 during the early Asian session on Wednesday. The quote has 14130/20 support-confluence as immediate strong downside barrier whereas 14,145/50 could act as the key region alternatively.
While a break of 50-day simple moving average (SMA) and two-month-old ascending trend-line, around 14,130/20, could drag prices to the 61.8% Fibonacci retracement of its February to March upside, at 14,070, sellers could aim for 14,000 round-figure during further declines.
Additionally, February 25 low near 13,950 and 13,900 might entertain bears ahead of pleasing them with the recent bottom adjacent to 13,860.
Meanwhile, successful break of 14,145/50 resistance-confluence including 100-day SMA and a fortnight old descending trend-line may continue challenging buyers targeting 14,350 and 14,450.
In a case when the quote continues to rise past-14,450, 14,510 and 14,600 could limit the pair’s further advances.
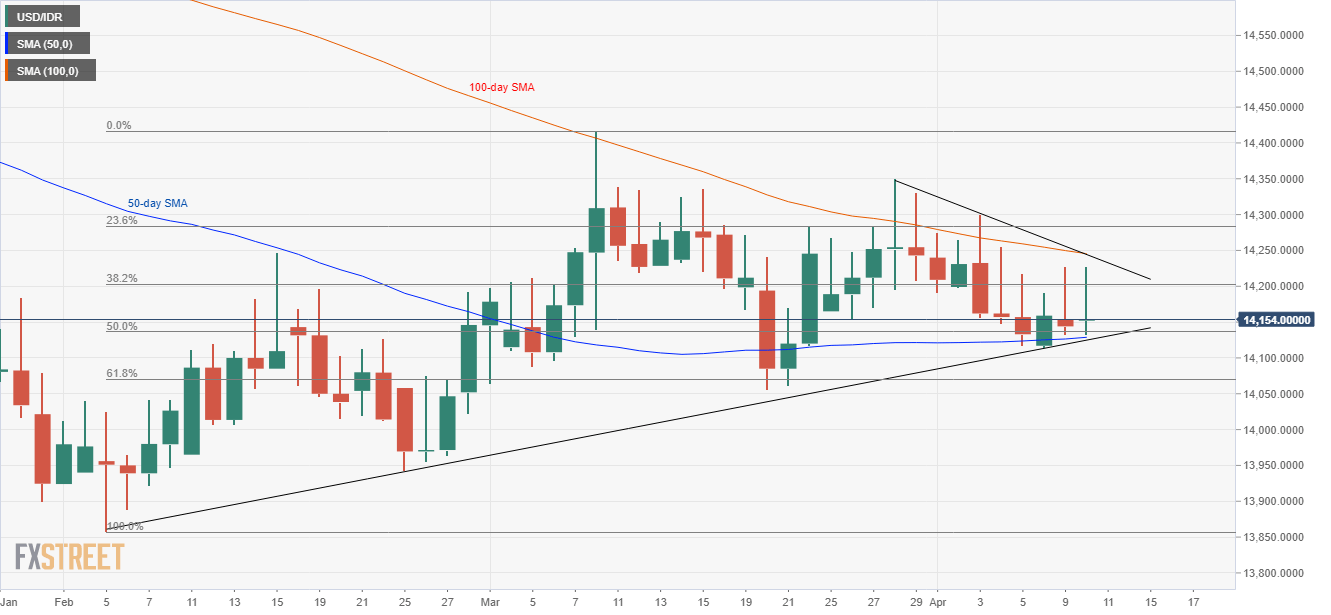
USD/IDR daily chart
Trend: Sideways
Pivot Points:
