The AUD/USD pair is close to the intra-day low of 0.7115 during early Wednesday despite Westpac consumer confidence grew beyond -4.8% earlier to +1.9%. The pair portrays symmetrical triangle formation if observing its moves from February 21.
Presently, 50-day simple moving average (SMA) acts as the closest support for the quote near 0.7115 ahead of dragging it to 0.7100 and 0.7090 consecutive rest-points.
However, triangle support near 0.7070 could challenge bears past-0.7090, if not then 0.7050, 0.7000 and 0.6980 could flash on their radar.
Alternatively, 0.7145/50 region including 100-day SMA and seven-week-old trend-line can limit the pair’s near-term upside, a break of which can propel it towards 200-day SMA level of 0.7200.
Though, an intermediate downward sloping trend-line from December 2018 could offer a rest near 0.7180.
During the pair’s rise past-0.7200, 0.7230 and 0.7300 are likely numbers to become the Bull’s favorites.
AUD/USD daily chart
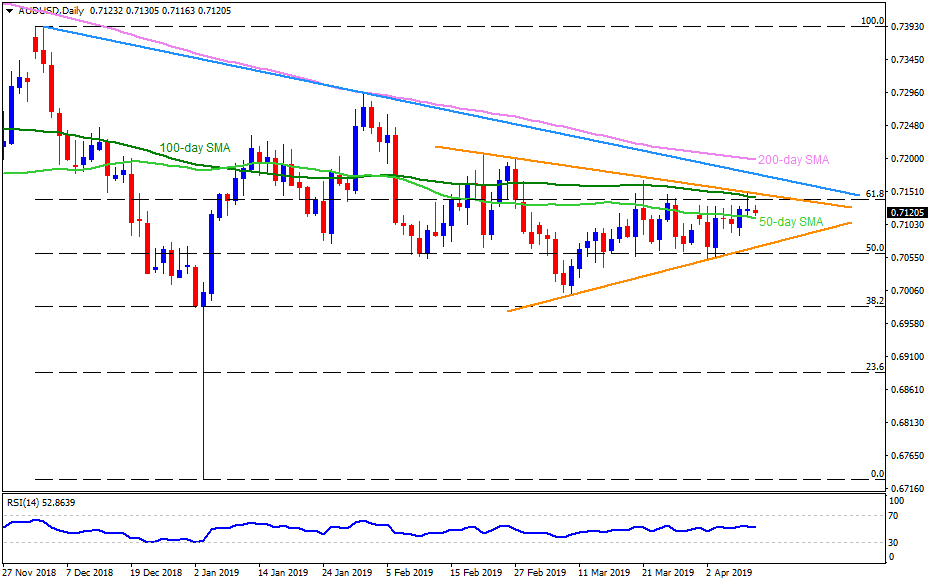
Trend: Pullback expected
